
Search for Indicators
All Data
Indicator Gauge Icon Legend
Legend Colors
Red is bad, green is good, blue is not statistically different/neutral.
Compared to Distribution
 the value is in the best half of communities.
 the value is in the 2nd worst quarter of communities.
 the value is in the worst quarter of communities.
Compared to Target
 meets target;
  does not meet target.
Compared to a Single Value
 lower than the comparison value;
 higher than the comparison value;
 not statistically different from comparison value.
Trend

 non-significant change over time;
 significant change over time;
  no change over time.
Compared to Prior Value
 higher than the previous measurement period;
 lower than the previous measurement period;
 no statistically different change from previous measurement period.
County: Klamath
Health / Other Conditions
Value
Compared to:
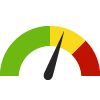
County: Klamath Adults with Kidney Disease
County: Klamath Adults with Kidney Disease
3.8%
(2021)
Compared to:


OR Counties
The distribution is based on data from 36 Oregon counties.
U.S. Counties
The distribution is based on data from 3,074 U.S. counties and county equivalents.
US Value
(3.1%)
The regional value is compared to the national value.
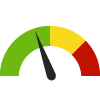
County: Klamath Chronic Kidney Disease: Medicare Population
County: Klamath Chronic Kidney Disease: Medicare Population
12.0%
(2022)
Compared to:

OR Counties
The distribution is based on data from 36 Oregon counties.
U.S. Counties
The distribution is based on data from 3,129 U.S. counties and county equivalents.
OR Value
(14.0%)
The regional value is compared to the Oregon State value.
US Value
(18.0%)
The regional value is compared to the national value.
Prior Value
(12.0%)
Prior Value compares a measured value with the previously measured value. Confidence intervals were not taken into account in determining the direction of the comparison.
Trend
This comparison measures the indicator’s values over multiple time periods.<br>The Mann-Kendall Test for Statistical Significance is used to evaluate the trend<br>over 4 to 10 periods of measure, subject to data availability and comparability.
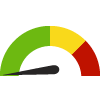
County: Klamath Osteoporosis: Medicare Population
County: Klamath Osteoporosis: Medicare Population
9.0%
(2022)
Compared to:

OR Counties
The distribution is based on data from 36 Oregon counties.
U.S. Counties
The distribution is based on data from 3,129 U.S. counties and county equivalents.
OR Value
(10.0%)
The regional value is compared to the Oregon State value.
US Value
(11.0%)
The regional value is compared to the national value.
Prior Value
(9.0%)
Prior Value compares a measured value with the previously measured value. Confidence intervals were not taken into account in determining the direction of the comparison.
Trend
This comparison measures the indicator’s values over multiple time periods.<br>The Mann-Kendall Test for Statistical Significance is used to evaluate the trend<br>over 4 to 10 periods of measure, subject to data availability and comparability.
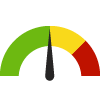
County: Klamath Rheumatoid Arthritis or Osteoarthritis: Medicare Population
County: Klamath Rheumatoid Arthritis or Osteoarthritis: Medicare Population
31.0%
(2022)
Compared to:

OR Counties
The distribution is based on data from 36 Oregon counties.
U.S. Counties
The distribution is based on data from 3,129 U.S. counties and county equivalents.
OR Value
(31.0%)
The regional value is compared to the Oregon State value.
US Value
(35.0%)
The regional value is compared to the national value.
Prior Value
(31.0%)
Prior Value compares a measured value with the previously measured value. Confidence intervals were not taken into account in determining the direction of the comparison.
Trend
This comparison measures the indicator’s values over multiple time periods.<br>The Mann-Kendall Test for Statistical Significance is used to evaluate the trend<br>over 4 to 10 periods of measure, subject to data availability and comparability.
County: Klamath
Health / Physical Activity
Value
Compared to:
County: Klamath Adults 20+ who are Sedentary
County: Klamath Adults 20+ who are Sedentary
17.6%
(2021)
Compared to:
OR Counties
The distribution is based on data from 36 Oregon counties.
U.S. Counties
The distribution is based on data from 3,074 U.S. counties and county equivalents.
Prior Value
(22.0%)
Prior Value compares a measured value with the previously measured value. Confidence intervals were taken into account in determining the direction of the comparison.
Trend
This comparison measures the indicator’s values over multiple time periods.<br>The Mann-Kendall Test for Statistical Significance is used to evaluate the trend<br>over 4 to 10 periods of measure, subject to data availability and comparability.
County: Klamath Adults Engaging in Regular Physical Activity
County: Klamath Adults Engaging in Regular Physical Activity
19.6%
(2014-2017)
Compared to:


OR Counties
The distribution is based on data from 28 Oregon counties.
OR Value
(22.7%)
The regional value is compared to the Oregon State value.
Prior Value
(25.4%)
Prior Value compares a measured value with the previously measured value. Confidence intervals were not taken into account in determining the direction of the comparison.
HP 2030 Target
(29.7%)
<div>PA-05: Increase the proportion of adults who do enough aerobic and muscle-strengthening activity <strong>(LEADING HEALTH INDICATOR)</strong></div>
County: Klamath
Health / Prevention & Safety
Value
Compared to:
County: Klamath Age-Adjusted Death Rate due to Falls
County: Klamath Age-Adjusted Death Rate due to Falls
14.0
Deaths per 100,000 population
(2018-2020)
Compared to:
OR Counties
(2017-2019)
The distribution is based on data from 20 Oregon counties.
U.S. Counties
The distribution is based on data from 988 U.S. counties and county equivalents.
OR Value
(14.5)
The regional value is compared to the Oregon State value.
US Value
(9.8)
The regional value is compared to the national value.
Prior Value
(15.7)
Prior Value compares a measured value with the previously measured value. Confidence intervals were taken into account in determining the direction of the comparison.
Trend
This comparison measures the indicator’s values over multiple time periods.<br>The Mann-Kendall Test for Statistical Significance is used to evaluate the trend<br>over 4 to 10 periods of measure, subject to data availability and comparability.
County: Klamath Age-Adjusted Death Rate due to Firearms
County: Klamath Age-Adjusted Death Rate due to Firearms
24.0
Deaths per 100,000 population
(2018-2020)
Compared to:

U.S. Counties
The distribution is based on data from 1,083 U.S. counties and county equivalents.
OR Value
(11.8)
The regional value is compared to the Oregon State value.
US Value
(12.0)
The regional value is compared to the national value.
Prior Value
(25.9)
Prior Value compares a measured value with the previously measured value. Confidence intervals were taken into account in determining the direction of the comparison.
Trend
This comparison measures the indicator’s values over multiple time periods.<br>The Mann-Kendall Test for Statistical Significance is used to evaluate the trend<br>over 4 to 10 periods of measure, subject to data availability and comparability.
HP 2030 Target
(10.7)
County: Klamath Age-Adjusted Death Rate due to Unintentional Poisonings
County: Klamath Age-Adjusted Death Rate due to Unintentional Poisonings
20.4
Deaths per 100,000 population
(2018-2020)
Compared to:
U.S. Counties
The distribution is based on data from 1,306 U.S. counties and county equivalents.
OR Value
(15.1)
The regional value is compared to the Oregon State value.
US Value
(23.5)
The regional value is compared to the national value.
Prior Value
(20.7)
Prior Value compares a measured value with the previously measured value. Confidence intervals were taken into account in determining the direction of the comparison.
Trend
This comparison measures the indicator’s values over multiple time periods.<br>The Mann-Kendall Test for Statistical Significance is used to evaluate the trend<br>over 4 to 10 periods of measure, subject to data availability and comparability.
County: Klamath
Health / Respiratory Diseases
Value
Compared to:
County: Klamath Adults with COPD
County: Klamath Adults with COPD
9.3%
Percent of adults
(2021)
Compared to:
OR Counties
The distribution is based on data from 36 Oregon counties.
U.S. Counties
The distribution is based on data from 3,074 U.S. counties and county equivalents.
US Value
(6.4%)
The regional value is compared to the national value.
County: Klamath Adults with Current Asthma
County: Klamath Adults with Current Asthma
11.3%
(2021)
Compared to:
OR Counties
The distribution is based on data from 36 Oregon counties.
U.S. Counties
The distribution is based on data from 3,074 U.S. counties and county equivalents.
US Value
(9.7%)
The regional value is compared to the national value.
County: Klamath Asthma: Medicare Population
County: Klamath Asthma: Medicare Population
6.0%
(2022)
Compared to:
OR Counties
The distribution is based on data from 36 Oregon counties.
U.S. Counties
The distribution is based on data from 3,129 U.S. counties and county equivalents.
OR Value
(6.0%)
The regional value is compared to the Oregon State value.
US Value
(7.0%)
The regional value is compared to the national value.
Prior Value
(6.0%)
Prior Value compares a measured value with the previously measured value. Confidence intervals were not taken into account in determining the direction of the comparison.
Trend
This comparison measures the indicator’s values over multiple time periods.<br>The Mann-Kendall Test for Statistical Significance is used to evaluate the trend<br>over 4 to 10 periods of measure, subject to data availability and comparability.
County: Klamath COPD: Medicare Population
County: Klamath COPD: Medicare Population
12.0%
(2022)
Compared to:
OR Counties
The distribution is based on data from 36 Oregon counties.
U.S. Counties
The distribution is based on data from 3,129 U.S. counties and county equivalents.
OR Value
(9.0%)
The regional value is compared to the Oregon State value.
US Value
(11.0%)
The regional value is compared to the national value.
Prior Value
(13.0%)
Prior Value compares a measured value with the previously measured value. Confidence intervals were not taken into account in determining the direction of the comparison.
Trend
This comparison measures the indicator’s values over multiple time periods.<br>The Mann-Kendall Test for Statistical Significance is used to evaluate the trend<br>over 4 to 10 periods of measure, subject to data availability and comparability.
County: Klamath
Health / Sexually Transmitted Infections
Value
Compared to:
County: Klamath Chlamydia Incidence Rate
County: Klamath Chlamydia Incidence Rate
321.9
Cases per 100,000 population
(2022)
Compared to:
OR Counties
The distribution is based on data from 36 Oregon counties.
U.S. Counties
The distribution is based on data from 3,132 U.S. counties and county equivalents.
OR Value
(365.6)
The regional value is compared to the Oregon State value.
US Value
(495.0)
The regional value is compared to the national value.
Prior Value
(376.3)
Prior Value compares a measured value with the previously measured value. Confidence intervals were not taken into account in determining the direction of the comparison.
Trend
This comparison measures the indicator’s values over multiple time periods.<br>The Mann-Kendall Test for Statistical Significance is used to evaluate the trend<br>over 4 to 10 periods of measure, subject to data availability and comparability.
County: Klamath Gonorrhea Incidence Rate
County: Klamath Gonorrhea Incidence Rate
153.8
Cases per 100,000 population
(2022)
Compared to:
OR Counties
The distribution is based on data from 36 Oregon counties.
U.S. Counties
The distribution is based on data from 3,132 U.S. counties and county equivalents.
OR Value
(129.6)
The regional value is compared to the Oregon State value.
US Value
(194.4)
The regional value is compared to the national value.
Prior Value
(258.0)
Prior Value compares a measured value with the previously measured value. Confidence intervals were not taken into account in determining the direction of the comparison.
Trend
This comparison measures the indicator’s values over multiple time periods.<br>The Mann-Kendall Test for Statistical Significance is used to evaluate the trend<br>over 4 to 10 periods of measure, subject to data availability and comparability.
County: Klamath HIV Diagnosed Cases
County: Klamath HIV Diagnosed Cases
0
Cases
(2016-2020)
Compared to:
Prior Value
Prior Value compares a measured value with the previously measured value. Confidence intervals were not taken into account in determining the direction of the comparison.
County: Klamath HPV Immunization Completion (13-to 17-year-olds)
County: Klamath HPV Immunization Completion (13-to 17-year-olds)
52.0%
(2022)
Compared to:
OR Value
(53.0%)
The regional value is compared to the Oregon State value.
Prior Value
(54.0%)
Prior Value compares a measured value with the previously measured value. Confidence intervals were not taken into account in determining the direction of the comparison.
Trend
This comparison measures the indicator’s values over multiple time periods.<br>The Mann-Kendall Test for Statistical Significance is used to evaluate the trend<br>over 4 to 10 periods of measure, subject to data availability and comparability.
County: Klamath HPV Immunization Completion (13-year-olds)
County: Klamath HPV Immunization Completion (13-year-olds)
38.0%
(2022)
Compared to:
OR Value
(35.0%)
The regional value is compared to the Oregon State value.
Prior Value
(36.0%)
Prior Value compares a measured value with the previously measured value. Confidence intervals were not taken into account in determining the direction of the comparison.
Trend
This comparison measures the indicator’s values over multiple time periods.<br>The Mann-Kendall Test for Statistical Significance is used to evaluate the trend<br>over 4 to 10 periods of measure, subject to data availability and comparability.
County: Klamath HPV Immunization Initiation (13-to 17-year-olds)
County: Klamath HPV Immunization Initiation (13-to 17-year-olds)
72.0%
(2022)
Compared to:
OR Value
(73.0%)
The regional value is compared to the Oregon State value.
Prior Value
(71.0%)
Prior Value compares a measured value with the previously measured value. Confidence intervals were not taken into account in determining the direction of the comparison.
Trend
This comparison measures the indicator’s values over multiple time periods.<br>The Mann-Kendall Test for Statistical Significance is used to evaluate the trend<br>over 4 to 10 periods of measure, subject to data availability and comparability.
County: Klamath HPV Immunization Initiation (13-year-olds)
County: Klamath HPV Immunization Initiation (13-year-olds)
65.0%
(2022)
Compared to:
OR Value
(63.0%)
The regional value is compared to the Oregon State value.
Prior Value
(63.0%)
Prior Value compares a measured value with the previously measured value. Confidence intervals were not taken into account in determining the direction of the comparison.
Trend
This comparison measures the indicator’s values over multiple time periods.<br>The Mann-Kendall Test for Statistical Significance is used to evaluate the trend<br>over 4 to 10 periods of measure, subject to data availability and comparability.
County: Klamath Syphilis Incidence Rate
County: Klamath Syphilis Incidence Rate
10.0
Cases per 100,000 population
(2022)
Compared to:


OR Counties
The distribution is based on data from 36 Oregon counties.
OR Value
(26.3)
The regional value is compared to the Oregon State value.
US Value
(17.7)
The regional value is compared to the national value.
Prior Value
(4.3)
Prior Value compares a measured value with the previously measured value. Confidence intervals were not taken into account in determining the direction of the comparison.
Trend
This comparison measures the indicator’s values over multiple time periods.<br>The Mann-Kendall Test for Statistical Significance is used to evaluate the trend<br>over 4 to 10 periods of measure, subject to data availability and comparability.
County: Klamath
Health / Tobacco Use
Value
Compared to:
County: Klamath 11th Grade Students Who Report Vaping or Using E-Cigarettes
County: Klamath 11th Grade Students Who Report Vaping or Using E-Cigarettes
12.2%
(2020)
Compared to:
OR Counties
(2019)
The distribution is based on data from 28 Oregon counties.
OR Value
(11.9%)
The regional value is compared to the Oregon State value.
Prior Value
(10.3%)
Prior Value compares a measured value with the previously measured value. Confidence intervals were not taken into account in determining the direction of the comparison.
Trend
This comparison measures the indicator’s values over multiple time periods.<br>The Mann-Kendall Test for Statistical Significance is used to evaluate the trend<br>over 4 to 10 periods of measure, subject to data availability and comparability.
County: Klamath 8th Grade Students Who Report Vaping or Using E-Cigarettes
County: Klamath 8th Grade Students Who Report Vaping or Using E-Cigarettes
8.0%
(2020)
Compared to:
OR Counties
(2019)
The distribution is based on data from 28 Oregon counties.
OR Value
(5.1%)
The regional value is compared to the Oregon State value.
Prior Value
(9.3%)
Prior Value compares a measured value with the previously measured value. Confidence intervals were not taken into account in determining the direction of the comparison.
Trend
This comparison measures the indicator’s values over multiple time periods.<br>The Mann-Kendall Test for Statistical Significance is used to evaluate the trend<br>over 4 to 10 periods of measure, subject to data availability and comparability.
County: Klamath Adults who Smoke
County: Klamath Adults who Smoke
17.8%
(2021)
Compared to:
OR Counties
The distribution is based on data from 36 Oregon counties.
U.S. Counties
The distribution is based on data from 3,074 U.S. counties and county equivalents.
US Value
(13.5%)
The regional value is compared to the national value.
HP 2030 Target
(6.1%)
<div>TU-02: Reduce current cigarette smoking in adults <strong>(LEADING HEALTH INDICATOR)</strong></div>
Healthy Klamath Target
(18.0%)
County: Klamath Students who Use Non-Cigarette Tobacco
County: Klamath Students who Use Non-Cigarette Tobacco
17.2%
(2020)
Compared to:
OR Counties
(2019)
The distribution is based on data from 28 Oregon counties.
OR Value
(16.1%)
The regional value is compared to the Oregon State value.
Prior Value
(5.0%)
Prior Value compares a measured value with the previously measured value. Confidence intervals were not taken into account in determining the direction of the comparison.
Trend
This comparison measures the indicator’s values over multiple time periods.<br>The Mann-Kendall Test for Statistical Significance is used to evaluate the trend<br>over 4 to 10 periods of measure, subject to data availability and comparability.
County: Klamath Tobacco-Linked Death Rate
County: Klamath Tobacco-Linked Death Rate
29.6%
(2021)
Compared to:
OR Counties
(2017)
The distribution is based on data from 36 Oregon counties.
OR Value
(18.9%)
The regional value is compared to the Oregon State value.
Prior Value
(38.6%)
Prior Value compares a measured value with the previously measured value. Confidence intervals were not taken into account in determining the direction of the comparison.
Trend
This comparison measures the indicator’s values over multiple time periods.<br>The Mann-Kendall Test for Statistical Significance is used to evaluate the trend<br>over 4 to 10 periods of measure, subject to data availability and comparability.
County: Klamath
Health / Weight Status
Value
Compared to:
County: Klamath Adults Who Are Obese
County: Klamath Adults Who Are Obese
28.4%
(2014-2017)
Compared to:
OR Counties
The distribution is based on data from 32 Oregon counties.
OR Value
(28.6%)
The regional value is compared to the Oregon State value.
US Value
(33.6% in 2022)
The regional value is compared to the national value. The source for the national value is Behavioral Risk Factor Surveillance System
Prior Value
(26.4%)
Prior Value compares a measured value with the previously measured value. Confidence intervals were not taken into account in determining the direction of the comparison.
Trend
This comparison measures the indicator’s values over multiple time periods.<br>The Mann-Kendall Test for Statistical Significance is used to evaluate the trend<br>over 4 to 10 periods of measure, subject to data availability and comparability.
Healthy Klamath Target
(21.0%)
<div>Being overweight is a major health risk and can cause many complications. </div>
County: Klamath Students who are Obese
County: Klamath Students who are Obese
21.1%
(2020)
Compared to:
OR Value
(15.3%)
The regional value is compared to the Oregon State value.
Prior Value
(15.5%)
Prior Value compares a measured value with the previously measured value. Confidence intervals were not taken into account in determining the direction of the comparison.
Trend
This comparison measures the indicator’s values over multiple time periods.<br>The Mann-Kendall Test for Statistical Significance is used to evaluate the trend<br>over 4 to 10 periods of measure, subject to data availability and comparability.
County: Klamath
Health / Wellness & Lifestyle
Value
Compared to:
County: Klamath Frequent Physical Distress
County: Klamath Frequent Physical Distress
14.5%
(2019)
Compared to:

OR Counties
The distribution is based on data from 36 Oregon counties.
U.S. Counties
The distribution is based on data from 3,121 U.S. counties and county equivalents.
OR Value
(11.5%)
The regional value is compared to the Oregon State value.
US Value
(12.0%)
The regional value is compared to the national value.
Prior Value
(15.9%)
Prior Value compares a measured value with the previously measured value. Confidence intervals were taken into account in determining the direction of the comparison.
County: Klamath Insufficient Sleep
County: Klamath Insufficient Sleep
32.1%
(2020)
Compared to:
OR Counties
The distribution is based on data from 36 Oregon counties.
U.S. Counties
The distribution is based on data from 3,140 U.S. counties and county equivalents.
OR Value
(29.0%)
The regional value is compared to the Oregon State value.
US Value
(33.0%)
The regional value is compared to the national value.
Prior Value
(35.5%)
Prior Value compares a measured value with the previously measured value. Confidence intervals were not taken into account in determining the direction of the comparison.
HP 2030 Target
(26.7%)
County: Klamath Poor Physical Health: 14+ Days
County: Klamath Poor Physical Health: 14+ Days
14.1%
(2021)
Compared to:
OR Counties
The distribution is based on data from 36 Oregon counties.
U.S. Counties
The distribution is based on data from 3,074 U.S. counties and county equivalents.
US Value
(10.9%)
The regional value is compared to the national value.
County: Klamath Self-Reported General Health Assessment: Good or Better
County: Klamath Self-Reported General Health Assessment: Good or Better
82.6%
(2014-2017)
Compared to:

OR Counties
The distribution is based on data from 33 Oregon counties.
OR Value
(83.0%)
The regional value is compared to the Oregon State value.
US Value
(83.0% in 2022)
The regional value is compared to the national value. The source for the national value is Behavioral Risk Factor Surveillance System
Prior Value
(78.5%)
Prior Value compares a measured value with the previously measured value. Confidence intervals were taken into account in determining the direction of the comparison.
Trend
This comparison measures the indicator’s values over multiple time periods.<br>The Mann-Kendall Test for Statistical Significance is used to evaluate the trend<br>over 4 to 10 periods of measure, subject to data availability and comparability.
County: Klamath Self-Reported General Health Assessment: Poor or Fair
County: Klamath Self-Reported General Health Assessment: Poor or Fair
19.9%
(2021)
Compared to:
OR Counties
The distribution is based on data from 36 Oregon counties.
U.S. Counties
The distribution is based on data from 3,074 U.S. counties and county equivalents.
US Value
(16.1%)
The regional value is compared to the national value.
County: Klamath
Community / Civic Engagement
Value
Compared to:
County: Klamath Voter Turnout: Presidential Election
County: Klamath Voter Turnout: Presidential Election
76.4%
(2020)
Compared to:

OR Counties
The distribution is based on data from 36 Oregon counties.
OR Value
(82.0%)
The regional value is compared to the Oregon State value.
Prior Value
(78.6%)
Prior Value compares a measured value with the previously measured value. Confidence intervals were not taken into account in determining the direction of the comparison.
Trend
This comparison measures the indicator’s values over multiple time periods.<br>The Mann-Kendall Test for Statistical Significance is used to evaluate the trend<br>over 4 to 10 periods of measure, subject to data availability and comparability.
HP 2030 Target
(58.4%)
<div>SDOH-07: Increase the proportion of the voting-age citizens who vote</div>
County: Klamath
Community / Demographics
Value
Compared to:
County: Klamath Average Household Size
County: Klamath Average Household Size
2.40
Persons per household
(2018-2022)
Compared to:


OR Value
(2.50)
The regional value is compared to the Oregon State value.
US Value
(2.60)
The regional value is compared to the national value.
Trend
This comparison measures the indicator’s values over multiple time periods.<br>The Mann-Kendall Test for Statistical Significance is used to evaluate the trend<br>over 4 to 10 periods of measure, subject to data availability and comparability.
County: Klamath Female Population
County: Klamath Female Population
49.7%
(2022)
Compared to:


OR Value
(50.1%)
The regional value is compared to the Oregon State value.
US Value
(50.4%)
The regional value is compared to the national value.
Prior Value
(49.8%)
Prior Value compares a measured value with the previously measured value. Confidence intervals were not taken into account in determining the direction of the comparison.
Trend
This comparison measures the indicator’s values over multiple time periods.<br>The Mann-Kendall Test for Statistical Significance is used to evaluate the trend<br>over 4 to 10 periods of measure, subject to data availability and comparability.
County: Klamath Foreign Born Persons
County: Klamath Foreign Born Persons
4.3%
(2018-2022)
Compared to:

OR Value
(9.8%)
The regional value is compared to the Oregon State value.
US Value
(13.7%)
The regional value is compared to the national value.
Trend
This comparison measures the indicator’s values over multiple time periods.<br>The Mann-Kendall Test for Statistical Significance is used to evaluate the trend<br>over 4 to 10 periods of measure, subject to data availability and comparability.
County: Klamath Households
County: Klamath Households
28,186
Households
(2018-2022)
Compared to:
Trend
This comparison measures the indicator’s values over multiple time periods.<br>The Mann-Kendall Test for Statistical Significance is used to evaluate the trend<br>over 4 to 10 periods of measure, subject to data availability and comparability.
County: Klamath Male Population
County: Klamath Male Population
50.3%
(2022)
Compared to:


OR Value
(49.9%)
The regional value is compared to the Oregon State value.
US Value
(49.6%)
The regional value is compared to the national value.
Prior Value
(50.2%)
Prior Value compares a measured value with the previously measured value. Confidence intervals were not taken into account in determining the direction of the comparison.
Trend
This comparison measures the indicator’s values over multiple time periods.<br>The Mann-Kendall Test for Statistical Significance is used to evaluate the trend<br>over 4 to 10 periods of measure, subject to data availability and comparability.
County: Klamath Persons per Square Mile
County: Klamath Persons per Square Mile
11.7
Persons per square mile
(2020)
Compared to:
OR Value
(44.1)
The regional value is compared to the Oregon State value.
US Value
(93.8)
The regional value is compared to the national value.
Prior Value
(11.2)
Prior Value compares a measured value with the previously measured value. Confidence intervals were not taken into account in determining the direction of the comparison.
8.9%
(2018-2022)
Compared to:

OR Value
(15.3%)
The regional value is compared to the Oregon State value.
US Value
(21.7%)
The regional value is compared to the national value.
Trend
This comparison measures the indicator’s values over multiple time periods.<br>The Mann-Kendall Test for Statistical Significance is used to evaluate the trend<br>over 4 to 10 periods of measure, subject to data availability and comparability.
County: Klamath Population American Indian and Alaska Native
County: Klamath Population American Indian and Alaska Native
5.0%
(2022)
Compared to:
OR Value
(1.9%)
The regional value is compared to the Oregon State value.
US Value
(1.3%)
The regional value is compared to the national value.
Prior Value
(5.0%)
Prior Value compares a measured value with the previously measured value. Confidence intervals were not taken into account in determining the direction of the comparison.
Trend
This comparison measures the indicator’s values over multiple time periods.<br>The Mann-Kendall Test for Statistical Significance is used to evaluate the trend<br>over 4 to 10 periods of measure, subject to data availability and comparability.
County: Klamath Population Asian
County: Klamath Population Asian
1.2%
(2022)
Compared to:
OR Value
(5.1%)
The regional value is compared to the Oregon State value.
US Value
(6.3%)
The regional value is compared to the national value.
Prior Value
(1.2%)
Prior Value compares a measured value with the previously measured value. Confidence intervals were not taken into account in determining the direction of the comparison.
Trend
This comparison measures the indicator’s values over multiple time periods.<br>The Mann-Kendall Test for Statistical Significance is used to evaluate the trend<br>over 4 to 10 periods of measure, subject to data availability and comparability.
County: Klamath Population Black or African American
County: Klamath Population Black or African American
0.9%
(2022)
Compared to:
OR Value
(2.3%)
The regional value is compared to the Oregon State value.
US Value
(13.6%)
The regional value is compared to the national value.
Prior Value
(0.9%)
Prior Value compares a measured value with the previously measured value. Confidence intervals were not taken into account in determining the direction of the comparison.
Trend
This comparison measures the indicator’s values over multiple time periods.<br>The Mann-Kendall Test for Statistical Significance is used to evaluate the trend<br>over 4 to 10 periods of measure, subject to data availability and comparability.
County: Klamath Population Hispanic or Latino
County: Klamath Population Hispanic or Latino
14.9%
(2022)
Compared to:
OR Value
(14.4%)
The regional value is compared to the Oregon State value.
US Value
(19.1%)
The regional value is compared to the national value.
Prior Value
(14.6%)
Prior Value compares a measured value with the previously measured value. Confidence intervals were not taken into account in determining the direction of the comparison.
Trend
This comparison measures the indicator’s values over multiple time periods.<br>The Mann-Kendall Test for Statistical Significance is used to evaluate the trend<br>over 4 to 10 periods of measure, subject to data availability and comparability.
County: Klamath Population Native Hawaiian and Other Pacific Islander
County: Klamath Population Native Hawaiian and Other Pacific Islander
0.2%
(2022)
Compared to:
OR Value
(0.5%)
The regional value is compared to the Oregon State value.
US Value
(0.3%)
The regional value is compared to the national value.
Prior Value
(0.2%)
Prior Value compares a measured value with the previously measured value. Confidence intervals were not taken into account in determining the direction of the comparison.
Trend
This comparison measures the indicator’s values over multiple time periods.<br>The Mann-Kendall Test for Statistical Significance is used to evaluate the trend<br>over 4 to 10 periods of measure, subject to data availability and comparability.
County: Klamath Population Over Age 65
County: Klamath Population Over Age 65
22.3%
(2022)
Compared to:
OR Value
(19.2%)
The regional value is compared to the Oregon State value.
US Value
(17.3%)
The regional value is compared to the national value.
Prior Value
(22.0%)
Prior Value compares a measured value with the previously measured value. Confidence intervals were not taken into account in determining the direction of the comparison.
Trend
This comparison measures the indicator’s values over multiple time periods.<br>The Mann-Kendall Test for Statistical Significance is used to evaluate the trend<br>over 4 to 10 periods of measure, subject to data availability and comparability.
County: Klamath Population Over Age 65 (Count)
County: Klamath Population Over Age 65 (Count)
14,909
People
(2018-2022)
Compared to:
Trend
This comparison measures the indicator’s values over multiple time periods.<br>The Mann-Kendall Test for Statistical Significance is used to evaluate the trend<br>over 4 to 10 periods of measure, subject to data availability and comparability.
County: Klamath Population Two or More Races
County: Klamath Population Two or More Races
4.7%
(2022)
Compared to:
OR Value
(4.3%)
The regional value is compared to the Oregon State value.
US Value
(3.0%)
The regional value is compared to the national value.
Prior Value
(4.6%)
Prior Value compares a measured value with the previously measured value. Confidence intervals were not taken into account in determining the direction of the comparison.
Trend
This comparison measures the indicator’s values over multiple time periods.<br>The Mann-Kendall Test for Statistical Significance is used to evaluate the trend<br>over 4 to 10 periods of measure, subject to data availability and comparability.
County: Klamath Population Under Age 18
County: Klamath Population Under Age 18
21.9%
(2022)
Compared to:
OR Value
(19.7%)
The regional value is compared to the Oregon State value.
US Value
(21.7%)
The regional value is compared to the national value.
Prior Value
(21.8%)
Prior Value compares a measured value with the previously measured value. Confidence intervals were not taken into account in determining the direction of the comparison.
Trend
This comparison measures the indicator’s values over multiple time periods.<br>The Mann-Kendall Test for Statistical Significance is used to evaluate the trend<br>over 4 to 10 periods of measure, subject to data availability and comparability.
County: Klamath Population Under Age 5
County: Klamath Population Under Age 5
5.7%
(2022)
Compared to:
OR Value
(4.9%)
The regional value is compared to the Oregon State value.
US Value
(5.6%)
The regional value is compared to the national value.
Prior Value
(5.7%)
Prior Value compares a measured value with the previously measured value. Confidence intervals were not taken into account in determining the direction of the comparison.
Trend
This comparison measures the indicator’s values over multiple time periods.<br>The Mann-Kendall Test for Statistical Significance is used to evaluate the trend<br>over 4 to 10 periods of measure, subject to data availability and comparability.
County: Klamath Population White
County: Klamath Population White
87.9%
(2022)
Compared to:
OR Value
(85.9%)
The regional value is compared to the Oregon State value.
US Value
(75.5%)
The regional value is compared to the national value.
Prior Value
(88.1%)
Prior Value compares a measured value with the previously measured value. Confidence intervals were not taken into account in determining the direction of the comparison.
Trend
This comparison measures the indicator’s values over multiple time periods.<br>The Mann-Kendall Test for Statistical Significance is used to evaluate the trend<br>over 4 to 10 periods of measure, subject to data availability and comparability.
County: Klamath Population White (Not Hispanic or Latino)
County: Klamath Population White (Not Hispanic or Latino)
75.8%
(2022)
Compared to:
OR Value
(73.5%)
The regional value is compared to the Oregon State value.
US Value
(58.9%)
The regional value is compared to the national value.
Prior Value
(76.2%)
Prior Value compares a measured value with the previously measured value. Confidence intervals were not taken into account in determining the direction of the comparison.
Trend
This comparison measures the indicator’s values over multiple time periods.<br>The Mann-Kendall Test for Statistical Significance is used to evaluate the trend<br>over 4 to 10 periods of measure, subject to data availability and comparability.
County: Klamath Total Population
County: Klamath Total Population
70,003
People
(2023)
Compared to:
Prior Value
(70,190)
Prior Value compares a measured value with the previously measured value. Confidence intervals were not taken into account in determining the direction of the comparison.
Trend
This comparison measures the indicator’s values over multiple time periods.<br>The Mann-Kendall Test for Statistical Significance is used to evaluate the trend<br>over 4 to 10 periods of measure, subject to data availability and comparability.
County: Klamath Veteran Population
County: Klamath Veteran Population
11.0%
(2018-2022)
Compared to:
OR Value
(7.8%)
The regional value is compared to the Oregon State value.
US Value
(6.6%)
The regional value is compared to the national value.
Trend
This comparison measures the indicator’s values over multiple time periods.<br>The Mann-Kendall Test for Statistical Significance is used to evaluate the trend<br>over 4 to 10 periods of measure, subject to data availability and comparability.
County: Klamath
Community / Public Safety
Value
Compared to:
County: Klamath Age-Adjusted Death Rate due to Motor Vehicle Traffic Collisions
County: Klamath Age-Adjusted Death Rate due to Motor Vehicle Traffic Collisions
18.6
Deaths per 100,000 population
(2018-2020)
Compared to:
OR Counties
The distribution is based on data from 20 Oregon counties.
U.S. Counties
The distribution is based on data from 1,266 U.S. counties and county equivalents.
OR Value
(11.1)
The regional value is compared to the Oregon State value.
US Value
(11.4)
The regional value is compared to the national value.
Prior Value
(18.5)
Prior Value compares a measured value with the previously measured value. Confidence intervals were taken into account in determining the direction of the comparison.
Trend
This comparison measures the indicator’s values over multiple time periods.<br>The Mann-Kendall Test for Statistical Significance is used to evaluate the trend<br>over 4 to 10 periods of measure, subject to data availability and comparability.
HP 2030 Target
(10.1)
County: Klamath Alcohol-Impaired Driving Deaths
County: Klamath Alcohol-Impaired Driving Deaths
25.3%
Percent of driving deaths with alcohol involvement
(2017-2021)
Compared to:
OR Counties
The distribution is based on data from 36 Oregon counties.
U.S. Counties
The distribution is based on data from 3,116 U.S. counties and county equivalents.
OR Value
(27.4%)
The regional value is compared to the Oregon State value.
US Value
(26.3%)
The regional value is compared to the national value.
Prior Value
(25.3%)
Prior Value compares a measured value with the previously measured value. Confidence intervals were taken into account in determining the direction of the comparison.
Trend
This comparison measures the indicator’s values over multiple time periods.<br>The Mann-Kendall Test for Statistical Significance is used to evaluate the trend<br>over 4 to 10 periods of measure, subject to data availability and comparability.
County: Klamath
Community / Social Environment
Value
Compared to:
County: Klamath Children in Single-Parent Households
County: Klamath Children in Single-Parent Households
23.1%
(2018-2022)
Compared to:
OR Counties
The distribution is based on data from 36 Oregon counties.
U.S. Counties
The distribution is based on data from 3,132 U.S. counties and county equivalents.
OR Value
(20.5%)
The regional value is compared to the Oregon State value.
US Value
(24.9%)
The regional value is compared to the national value.
Trend
This comparison measures the indicator’s values over multiple time periods.<br>The Mann-Kendall Test for Statistical Significance is used to evaluate the trend<br>over 4 to 10 periods of measure, subject to data availability and comparability.
County: Klamath Disconnected Youth
County: Klamath Disconnected Youth
16.7%
(2013-2017)
Compared to:
OR Counties
The distribution is based on data from 24 Oregon counties.
OR Value
(11.6%)
The regional value is compared to the Oregon State value.
US Value
(11.5%)
The regional value is compared to the national value.
County: Klamath Linguistic Isolation
County: Klamath Linguistic Isolation
1.7%
(2018-2022)
Compared to:
OR Counties
The distribution is based on data from 29 Oregon counties.
U.S. Counties
The distribution is based on data from 2,252 U.S. counties and county equivalents.
OR Value
(2.2%)
The regional value is compared to the Oregon State value.
US Value
(4.2%)
The regional value is compared to the national value.
Trend
This comparison measures the indicator’s values over multiple time periods.<br>The Mann-Kendall Test for Statistical Significance is used to evaluate the trend<br>over 4 to 10 periods of measure, subject to data availability and comparability.
County: Klamath People 65+ Living Alone
County: Klamath People 65+ Living Alone
28.8%
(2018-2022)
Compared to:
OR Counties
The distribution is based on data from 36 Oregon counties.
U.S. Counties
The distribution is based on data from 3,133 U.S. counties and county equivalents.
OR Value
(26.3%)
The regional value is compared to the Oregon State value.
US Value
(26.4%)
The regional value is compared to the national value.
Trend
This comparison measures the indicator’s values over multiple time periods.<br>The Mann-Kendall Test for Statistical Significance is used to evaluate the trend<br>over 4 to 10 periods of measure, subject to data availability and comparability.
County: Klamath People 65+ Living Alone (Count)
County: Klamath People 65+ Living Alone (Count)
4,289
People
(2018-2022)
Compared to:
Trend
This comparison measures the indicator’s values over multiple time periods.<br>The Mann-Kendall Test for Statistical Significance is used to evaluate the trend<br>over 4 to 10 periods of measure, subject to data availability and comparability.
County: Klamath Social Associations
County: Klamath Social Associations
9.5
Membership associations per 10,000 population
(2021)
Compared to:
OR Counties
The distribution is based on data from 36 Oregon counties.
U.S. Counties
The distribution is based on data from 3,141 U.S. counties and county equivalents.
OR Value
(9.8)
The regional value is compared to the Oregon State value.
US Value
(9.1)
The regional value is compared to the national value.
Prior Value
(10.3)
Prior Value compares a measured value with the previously measured value. Confidence intervals were not taken into account in determining the direction of the comparison.
Trend
This comparison measures the indicator’s values over multiple time periods.<br>The Mann-Kendall Test for Statistical Significance is used to evaluate the trend<br>over 4 to 10 periods of measure, subject to data availability and comparability.
County: Klamath Substantiated Child Abuse Rate
County: Klamath Substantiated Child Abuse Rate
21.5
Cases per 1,000 children
(2022)
Compared to:
OR Counties
The distribution is based on data from 34 Oregon counties.
OR Value
(12.4)
The regional value is compared to the Oregon State value.
US Value
(7.7)
The regional value is compared to the national value. The source for the national value is Children's Bureau
Prior Value
(21.6)
Prior Value compares a measured value with the previously measured value. Confidence intervals were not taken into account in determining the direction of the comparison.
Trend
This comparison measures the indicator’s values over multiple time periods.<br>The Mann-Kendall Test for Statistical Significance is used to evaluate the trend<br>over 4 to 10 periods of measure, subject to data availability and comparability.
HP 2030 Target
(8.7)
County: Klamath
Community / Transportation
Value
Compared to:
County: Klamath Households without a Vehicle
County: Klamath Households without a Vehicle
5.1%
(2018-2022)
Compared to:
OR Counties
The distribution is based on data from 36 Oregon counties.
U.S. Counties
The distribution is based on data from 3,133 U.S. counties and county equivalents.
OR Value
(7.0%)
The regional value is compared to the Oregon State value.
US Value
(8.3%)
The regional value is compared to the national value.
Trend
This comparison measures the indicator’s values over multiple time periods.<br>The Mann-Kendall Test for Statistical Significance is used to evaluate the trend<br>over 4 to 10 periods of measure, subject to data availability and comparability.
County: Klamath Mean Travel Time to Work
County: Klamath Mean Travel Time to Work
16.9
Minutes
(2018-2022)
Compared to:
OR Counties
The distribution is based on data from 36 Oregon counties.
U.S. Counties
The distribution is based on data from 3,131 U.S. counties and county equivalents.
OR Value
(23.3)
The regional value is compared to the Oregon State value.
US Value
(26.7)
The regional value is compared to the national value.
Trend
This comparison measures the indicator’s values over multiple time periods.<br>The Mann-Kendall Test for Statistical Significance is used to evaluate the trend<br>over 4 to 10 periods of measure, subject to data availability and comparability.
County: Klamath Solo Drivers with a Long Commute
County: Klamath Solo Drivers with a Long Commute
15.4%
(2018-2022)
Compared to:
OR Counties
The distribution is based on data from 36 Oregon counties.
U.S. Counties
The distribution is based on data from 3,141 U.S. counties and county equivalents.
OR Value
(29.8%)
The regional value is compared to the Oregon State value.
US Value
(36.4%)
The regional value is compared to the national value.
Prior Value
(13.9%)
Prior Value compares a measured value with the previously measured value. Confidence intervals were taken into account in determining the direction of the comparison.
Trend
This comparison measures the indicator’s values over multiple time periods.<br>The Mann-Kendall Test for Statistical Significance is used to evaluate the trend<br>over 4 to 10 periods of measure, subject to data availability and comparability.
County: Klamath Workers Commuting by Public Transportation
County: Klamath Workers Commuting by Public Transportation
0.2%
(2018-2022)
Compared to:
OR Counties
The distribution is based on data from 36 Oregon counties.
U.S. Counties
(2015-2019)
The distribution is based on data from 3,142 U.S. counties and county equivalents.
OR Value
(3.0%)
The regional value is compared to the Oregon State value.
US Value
(3.8%)
The regional value is compared to the national value.
Trend
This comparison measures the indicator’s values over multiple time periods.<br>The Mann-Kendall Test for Statistical Significance is used to evaluate the trend<br>over 4 to 10 periods of measure, subject to data availability and comparability.
HP 2030 Target
(5.3%)
Healthy Klamath Target
(1.5%)
County: Klamath Workers who Drive Alone to Work
County: Klamath Workers who Drive Alone to Work
80.9%
(2018-2022)
Compared to:
OR Counties
The distribution is based on data from 36 Oregon counties.
U.S. Counties
The distribution is based on data from 3,133 U.S. counties and county equivalents.
OR Value
(67.1%)
The regional value is compared to the Oregon State value.
US Value
(71.7%)
The regional value is compared to the national value.
Trend
This comparison measures the indicator’s values over multiple time periods.<br>The Mann-Kendall Test for Statistical Significance is used to evaluate the trend<br>over 4 to 10 periods of measure, subject to data availability and comparability.
County: Klamath Workers who Walk to Work
County: Klamath Workers who Walk to Work
2.6%
(2018-2022)
Compared to:
OR Counties
The distribution is based on data from 36 Oregon counties.
U.S. Counties
The distribution is based on data from 3,133 U.S. counties and county equivalents.
OR Value
(3.4%)
The regional value is compared to the Oregon State value.
US Value
(2.4%)
The regional value is compared to the national value.
Trend
This comparison measures the indicator’s values over multiple time periods.<br>The Mann-Kendall Test for Statistical Significance is used to evaluate the trend<br>over 4 to 10 periods of measure, subject to data availability and comparability.
Healthy Klamath Target
(6.0%)
County: Klamath
Economy / Employment
Value
Compared to:
County: Klamath Employer Establishments
County: Klamath Employer Establishments
1,548
Number of Establishments
(2021)
Compared to:
Prior Value
(1,530)
Prior Value compares a measured value with the previously measured value. Confidence intervals were not taken into account in determining the direction of the comparison.
Trend
This comparison measures the indicator’s values over multiple time periods.<br>The Mann-Kendall Test for Statistical Significance is used to evaluate the trend<br>over 4 to 10 periods of measure, subject to data availability and comparability.
County: Klamath Female Population 16+ in Civilian Labor Force
County: Klamath Female Population 16+ in Civilian Labor Force
48.5%
(2018-2022)
Compared to:
OR Counties
The distribution is based on data from 36 Oregon counties.
U.S. Counties
The distribution is based on data from 3,133 U.S. counties and county equivalents.
OR Value
(58.3%)
The regional value is compared to the Oregon State value.
US Value
(58.5%)
The regional value is compared to the national value.
Trend
This comparison measures the indicator’s values over multiple time periods.<br>The Mann-Kendall Test for Statistical Significance is used to evaluate the trend<br>over 4 to 10 periods of measure, subject to data availability and comparability.
County: Klamath Population 16+ in Civilian Labor Force
County: Klamath Population 16+ in Civilian Labor Force
47.4%
(2018-2022)
Compared to:
OR Counties
The distribution is based on data from 36 Oregon counties.
U.S. Counties
The distribution is based on data from 3,133 U.S. counties and county equivalents.
OR Value
(58.9%)
The regional value is compared to the Oregon State value.
US Value
(59.6%)
The regional value is compared to the national value.
Trend
This comparison measures the indicator’s values over multiple time periods.<br>The Mann-Kendall Test for Statistical Significance is used to evaluate the trend<br>over 4 to 10 periods of measure, subject to data availability and comparability.
County: Klamath Size of Labor Force
County: Klamath Size of Labor Force
30,329
Persons
(January 2024)
Compared to:
Prior Value
(29,958)
Prior Value compares a measured value with the previously measured value. Confidence intervals were not taken into account in determining the direction of the comparison.
Trend
This comparison measures the indicator’s values over multiple time periods.<br>The Mann-Kendall Test for Statistical Significance is used to evaluate the trend<br>over 4 to 10 periods of measure, subject to data availability and comparability.
County: Klamath Total Employment
County: Klamath Total Employment
17,252
Paid Employees
(2021)
Compared to:
Prior Value
(17,036)
Prior Value compares a measured value with the previously measured value. Confidence intervals were not taken into account in determining the direction of the comparison.
Trend
This comparison measures the indicator’s values over multiple time periods.<br>The Mann-Kendall Test for Statistical Significance is used to evaluate the trend<br>over 4 to 10 periods of measure, subject to data availability and comparability.
County: Klamath Total Employment Change
County: Klamath Total Employment Change
1.3%
(2020-2021)
Compared to:
OR Counties
The distribution is based on data from 36 Oregon counties.
U.S. Counties
The distribution is based on data from 3,140 U.S. counties and county equivalents.
OR Value
(-5.3%)
The regional value is compared to the Oregon State value.
US Value
(-4.3%)
The regional value is compared to the national value.
Prior Value
(-1.0%)
Prior Value compares a measured value with the previously measured value. Confidence intervals were not taken into account in determining the direction of the comparison.
Trend
This comparison measures the indicator’s values over multiple time periods.<br>The Mann-Kendall Test for Statistical Significance is used to evaluate the trend<br>over 4 to 10 periods of measure, subject to data availability and comparability.
County: Klamath Unemployed Workers in Civilian Labor Force
County: Klamath Unemployed Workers in Civilian Labor Force
7.4%
(January 2024)
Compared to:
OR Counties
The distribution is based on data from 36 Oregon counties.
U.S. Counties
The distribution is based on non-seasonally-adjusted data from 3,140 U.S. counties and county equivalents.
OR Value
(4.9%)
The regional value is compared to the Oregon State value.
US Value
(4.1%)
The regional value is compared to the national value.
Prior Value
(5.9%)
Prior Value compares a measured value with the previously measured value. Confidence intervals were not taken into account in determining the direction of the comparison.
Trend
This comparison measures the indicator’s values over multiple time periods.<br>The Mann-Kendall Test for Statistical Significance is used to evaluate the trend<br>over 4 to 10 periods of measure, subject to data availability and comparability.
County: Klamath
Economy / Food Insecurity
Value
Compared to:
County: Klamath Child Food Insecurity Rate
County: Klamath Child Food Insecurity Rate
18.0%
(2021)
Compared to:
OR Counties
The distribution is based on data from 36 Oregon counties.
U.S. Counties
The distribution is based on data from 3,140 U.S. counties and county equivalents.
OR Value
(12.4%)
The regional value is compared to the Oregon State value.
US Value
(12.8%)
The regional value is compared to the national value.
Prior Value
(21.4%)
Prior Value compares a measured value with the previously measured value. Confidence intervals were not taken into account in determining the direction of the comparison.
Trend
This comparison measures the indicator’s values over multiple time periods.<br>The Mann-Kendall Test for Statistical Significance is used to evaluate the trend<br>over 4 to 10 periods of measure, subject to data availability and comparability.
County: Klamath Food Insecure Children Likely Ineligible for Assistance
County: Klamath Food Insecure Children Likely Ineligible for Assistance
12%
(2021)
Compared to:
OR Counties
The distribution is based on data from 36 Oregon counties.
U.S. Counties
The distribution is based on data from 3,134 U.S. counties and county equivalents.
OR Value
(26%)
The regional value is compared to the Oregon State value.
US Value
(25%)
The regional value is compared to the national value.
Prior Value
(12%)
Prior Value compares a measured value with the previously measured value. Confidence intervals were not taken into account in determining the direction of the comparison.
Trend
This comparison measures the indicator’s values over multiple time periods.<br>The Mann-Kendall Test for Statistical Significance is used to evaluate the trend<br>over 4 to 10 periods of measure, subject to data availability and comparability.
County: Klamath Food Insecurity Rate
County: Klamath Food Insecurity Rate
13.6%
(2021)
Compared to:
OR Counties
The distribution is based on data from 36 Oregon counties.
U.S. Counties
The distribution is based on data from 3,140 U.S. counties and county equivalents.
OR Value
(10.5%)
The regional value is compared to the Oregon State value.
US Value
(10.4%)
The regional value is compared to the national value.
Prior Value
(14.7%)
Prior Value compares a measured value with the previously measured value. Confidence intervals were not taken into account in determining the direction of the comparison.
Trend
This comparison measures the indicator’s values over multiple time periods.<br>The Mann-Kendall Test for Statistical Significance is used to evaluate the trend<br>over 4 to 10 periods of measure, subject to data availability and comparability.
County: Klamath Households Receiving SNAP with Children
County: Klamath Households Receiving SNAP with Children
37.0%
(2018-2022)
Compared to:
OR Value
(40.4%)
The regional value is compared to the Oregon State value.
US Value
(47.9%)
The regional value is compared to the national value.
Trend
This comparison measures the indicator’s values over multiple time periods.<br>The Mann-Kendall Test for Statistical Significance is used to evaluate the trend<br>over 4 to 10 periods of measure, subject to data availability and comparability.
County: Klamath Households Receiving SNAP with Children (Count)
County: Klamath Households Receiving SNAP with Children (Count)
2,354
Households
(2018-2022)
Compared to:
Trend
This comparison measures the indicator’s values over multiple time periods.<br>The Mann-Kendall Test for Statistical Significance is used to evaluate the trend<br>over 4 to 10 periods of measure, subject to data availability and comparability.
County: Klamath Projected Child Food Insecurity Rate
County: Klamath Projected Child Food Insecurity Rate
22.5%
(2021)
Compared to:
OR Counties
The distribution is based on data from 36 Oregon counties.
U.S. Counties
The distribution is based on data from 3,142 U.S. counties and county equivalents.
OR Value
(15.4%)
The regional value is compared to the Oregon State value.
Prior Value
(34.2%)
Prior Value compares a measured value with the previously measured value. Confidence intervals were not taken into account in determining the direction of the comparison.
County: Klamath Projected Food Insecurity Rate
County: Klamath Projected Food Insecurity Rate
15.9%
(2021)
Compared to:
OR Counties
The distribution is based on data from 36 Oregon counties.
U.S. Counties
The distribution is based on data from 3,142 U.S. counties and county equivalents.
OR Value
(12.3%)
The regional value is compared to the Oregon State value.
Prior Value
(21.7%)
Prior Value compares a measured value with the previously measured value. Confidence intervals were not taken into account in determining the direction of the comparison.
County: Klamath Students Eligible for the Free Lunch Program
County: Klamath Students Eligible for the Free Lunch Program
77.6%
(2022-2023)
Compared to:
OR Counties
The distribution is based on data from 36 Oregon counties.
U.S. Counties
The distribution is based on data from 2,710 U.S. counties and county equivalents.
OR Value
(50.3%)
The regional value is compared to the Oregon State value.
US Value
(42.8%)
The regional value is compared to the national value.
Prior Value
(55.9%)
Prior Value compares a measured value with the previously measured value. Confidence intervals were not taken into account in determining the direction of the comparison.
Trend
This comparison measures the indicator’s values over multiple time periods.<br>The Mann-Kendall Test for Statistical Significance is used to evaluate the trend<br>over 4 to 10 periods of measure, subject to data availability and comparability.
County: Klamath
Economy / Government Assistance
Value
Compared to:
County: Klamath Children Enrolled in Temporary Assistance for Needy Families
County: Klamath Children Enrolled in Temporary Assistance for Needy Families
926
Average monthly number of children
(2019)
Compared to:
Prior Value
(826)
Prior Value compares a measured value with the previously measured value. Confidence intervals were not taken into account in determining the direction of the comparison.
Trend
This comparison measures the indicator’s values over multiple time periods.<br>The Mann-Kendall Test for Statistical Significance is used to evaluate the trend<br>over 4 to 10 periods of measure, subject to data availability and comparability.
County: Klamath Households with Cash Public Assistance Income
County: Klamath Households with Cash Public Assistance Income
4.0%
(2018-2022)
Compared to:
OR Counties
The distribution is based on data from 36 Oregon counties.
U.S. Counties
The distribution is based on data from 2,923 U.S. counties and county equivalents.
OR Value
(4.0%)
The regional value is compared to the Oregon State value.
US Value
(2.7%)
The regional value is compared to the national value.
Trend
This comparison measures the indicator’s values over multiple time periods.<br>The Mann-Kendall Test for Statistical Significance is used to evaluate the trend<br>over 4 to 10 periods of measure, subject to data availability and comparability.
County: Klamath
Economy / Housing & Homes
Value
Compared to:
County: Klamath Homeless Population
County: Klamath Homeless Population
192.0
People
(2017)
Compared to:
OR Value
(13,953.0)
The regional value is compared to the Oregon State value.
Prior Value
(252.0)
Prior Value compares a measured value with the previously measured value. Confidence intervals were not taken into account in determining the direction of the comparison.
County: Klamath Homeowner Vacancy Rate
County: Klamath Homeowner Vacancy Rate
1.5%
(2018-2022)
Compared to:
OR Counties
The distribution is based on data from 36 Oregon counties.
U.S. Counties
The distribution is based on data from 3,132 U.S. counties and county equivalents.
OR Value
(0.8%)
The regional value is compared to the Oregon State value.
US Value
(1.1%)
The regional value is compared to the national value.
Trend
This comparison measures the indicator’s values over multiple time periods.<br>The Mann-Kendall Test for Statistical Significance is used to evaluate the trend<br>over 4 to 10 periods of measure, subject to data availability and comparability.
County: Klamath Homeownership
County: Klamath Homeownership
57.5%
(2018-2022)
Compared to:
OR Counties
The distribution is based on data from 36 Oregon counties.
U.S. Counties
The distribution is based on data from 3,133 U.S. counties and county equivalents.
OR Value
(58.4%)
The regional value is compared to the Oregon State value.
US Value
(57.8%)
The regional value is compared to the national value.
Trend
This comparison measures the indicator’s values over multiple time periods.<br>The Mann-Kendall Test for Statistical Significance is used to evaluate the trend<br>over 4 to 10 periods of measure, subject to data availability and comparability.
County: Klamath Housing Units
County: Klamath Housing Units
33,200
Housing units
(2022)
Compared to:
Prior Value
(32,945)
Prior Value compares a measured value with the previously measured value. Confidence intervals were not taken into account in determining the direction of the comparison.
Trend
This comparison measures the indicator’s values over multiple time periods.<br>The Mann-Kendall Test for Statistical Significance is used to evaluate the trend<br>over 4 to 10 periods of measure, subject to data availability and comparability.
County: Klamath Median Household Gross Rent
County: Klamath Median Household Gross Rent
$921
(2018-2022)
Compared to:
OR Counties
The distribution is based on data from 36 Oregon counties.
OR Value
($1,373)
The regional value is compared to the Oregon State value.
US Value
($1,268)
The regional value is compared to the national value.
Trend
This comparison measures the indicator’s values over multiple time periods.<br>The Mann-Kendall Test for Statistical Significance is used to evaluate the trend<br>over 4 to 10 periods of measure, subject to data availability and comparability.
County: Klamath Median Housing Unit Value
County: Klamath Median Housing Unit Value
$234,200
(2018-2022)
Compared to:
OR Counties
The distribution is based on data from 36 Oregon counties.
OR Value
($423,100)
The regional value is compared to the Oregon State value.
US Value
($281,900)
The regional value is compared to the national value.
Trend
This comparison measures the indicator’s values over multiple time periods.<br>The Mann-Kendall Test for Statistical Significance is used to evaluate the trend<br>over 4 to 10 periods of measure, subject to data availability and comparability.
County: Klamath Median Monthly Owner Costs for Households without a Mortgage
County: Klamath Median Monthly Owner Costs for Households without a Mortgage
$386
(2018-2022)
Compared to:
OR Counties
The distribution is based on data from 36 Oregon counties.
OR Value
($634)
The regional value is compared to the Oregon State value.
US Value
($584)
The regional value is compared to the national value.
Trend
This comparison measures the indicator’s values over multiple time periods.<br>The Mann-Kendall Test for Statistical Significance is used to evaluate the trend<br>over 4 to 10 periods of measure, subject to data availability and comparability.
County: Klamath Mortgaged Owners Median Monthly Household Costs
County: Klamath Mortgaged Owners Median Monthly Household Costs
$1,391
(2018-2022)
Compared to:
OR Counties
The distribution is based on data from 36 Oregon counties.
OR Value
($1,984)
The regional value is compared to the Oregon State value.
US Value
($1,828)
The regional value is compared to the national value.
Trend
This comparison measures the indicator’s values over multiple time periods.<br>The Mann-Kendall Test for Statistical Significance is used to evaluate the trend<br>over 4 to 10 periods of measure, subject to data availability and comparability.
31.7%
(2022)
Compared to:
U.S. Counties
The distribution is based on data from 828 U.S. counties and county equivalents.
OR Value
(31.8%)
The regional value is compared to the Oregon State value.
US Value
(27.8%)
The regional value is compared to the national value.
Prior Value
(27.9%)
Prior Value compares a measured value with the previously measured value. Confidence intervals were not taken into account in determining the direction of the comparison.
Trend
This comparison measures the indicator’s values over multiple time periods.<br>The Mann-Kendall Test for Statistical Significance is used to evaluate the trend<br>over 4 to 10 periods of measure, subject to data availability and comparability.
HP 2030 Target
(25.5%)
County: Klamath Overcrowded Households
County: Klamath Overcrowded Households
2.1%
(2018-2022)
Compared to:
OR Counties
The distribution is based on data from 36 Oregon counties.
OR Value
(3.2%)
The regional value is compared to the Oregon State value.
US Value
(3.4%)
The regional value is compared to the national value.
Trend
This comparison measures the indicator’s values over multiple time periods.<br>The Mann-Kendall Test for Statistical Significance is used to evaluate the trend<br>over 4 to 10 periods of measure, subject to data availability and comparability.
County: Klamath Renters Spending 30% or More of Household Income on Rent
County: Klamath Renters Spending 30% or More of Household Income on Rent
51.0%
(2018-2022)
Compared to:
OR Counties
The distribution is based on data from 36 Oregon counties.
U.S. Counties
The distribution is based on data from 3,132 U.S. counties and county equivalents.
OR Value
(50.9%)
The regional value is compared to the Oregon State value.
US Value
(49.9%)
The regional value is compared to the national value.
Trend
This comparison measures the indicator’s values over multiple time periods.<br>The Mann-Kendall Test for Statistical Significance is used to evaluate the trend<br>over 4 to 10 periods of measure, subject to data availability and comparability.
HP 2030 Target
(25.5%)
County: Klamath Severe Housing Problems
County: Klamath Severe Housing Problems
19.6%
(2016-2020)
Compared to:
OR Counties
The distribution is based on data from 36 Oregon counties.
U.S. Counties
The distribution is based on data from 3,141 U.S. counties and county equivalents.
OR Value
(18.0%)
The regional value is compared to the Oregon State value.
US Value
(16.7%)
The regional value is compared to the national value.
Prior Value
(18.7%)
Prior Value compares a measured value with the previously measured value. Confidence intervals were taken into account in determining the direction of the comparison.
Trend
This comparison measures the indicator’s values over multiple time periods.<br>The Mann-Kendall Test for Statistical Significance is used to evaluate the trend<br>over 4 to 10 periods of measure, subject to data availability and comparability.
County: Klamath
Economy / Income
Value
Compared to:
52.5%
(2021)
Compared to:
OR Counties
The distribution is based on data from 36 Oregon counties.
OR Value
(56.0%)
The regional value is compared to the Oregon State value.
Prior Value
(51.9%)
Prior Value compares a measured value with the previously measured value. Confidence intervals were not taken into account in determining the direction of the comparison.
27.1%
(2021)
Compared to:
OR Counties
The distribution is based on data from 36 Oregon counties.
OR Value
(32.0%)
The regional value is compared to the Oregon State value.
Prior Value
(29.4%)
Prior Value compares a measured value with the previously measured value. Confidence intervals were not taken into account in determining the direction of the comparison.
County: Klamath Income Inequality
County: Klamath Income Inequality
0.467
(2018-2022)
Compared to:
OR Counties
The distribution is based on data from 36 Oregon counties.
U.S. Counties
The distribution is based on data from 3,133 U.S. counties and county equivalents.
OR Value
(0.461)
The regional value is compared to the Oregon State value.
US Value
(0.483)
The regional value is compared to the national value.
Trend
This comparison measures the indicator’s values over multiple time periods.<br>The Mann-Kendall Test for Statistical Significance is used to evaluate the trend<br>over 4 to 10 periods of measure, subject to data availability and comparability.
County: Klamath Median Household Income
County: Klamath Median Household Income
$57,219
(2018-2022)
Compared to:
OR Counties
The distribution is based on data from 36 Oregon counties.
U.S. Counties
The distribution is based on data from 3,132 U.S. counties and county equivalents.
OR Value
($76,632)
The regional value is compared to the Oregon State value.
US Value
($75,149)
The regional value is compared to the national value.
Trend
This comparison measures the indicator’s values over multiple time periods.<br>The Mann-Kendall Test for Statistical Significance is used to evaluate the trend<br>over 4 to 10 periods of measure, subject to data availability and comparability.
County: Klamath Per Capita Income
County: Klamath Per Capita Income
$31,260
(2018-2022)
Compared to:
OR Counties
The distribution is based on data from 36 Oregon counties.
U.S. Counties
The distribution is based on data from 3,133 U.S. counties and county equivalents.
OR Value
($41,805)
The regional value is compared to the Oregon State value.
US Value
($41,261)
The regional value is compared to the national value.
Trend
This comparison measures the indicator’s values over multiple time periods.<br>The Mann-Kendall Test for Statistical Significance is used to evaluate the trend<br>over 4 to 10 periods of measure, subject to data availability and comparability.
County: Klamath
Economy / Poverty
Value
Compared to:
County: Klamath Children Living Below Poverty Level
County: Klamath Children Living Below Poverty Level
22.1%
(2018-2022)
Compared to:
OR Counties
The distribution is based on data from 36 Oregon counties.
U.S. Counties
The distribution is based on data from 3,132 U.S. counties and county equivalents.
OR Value
(13.5%)
The regional value is compared to the Oregon State value.
US Value
(16.7%)
The regional value is compared to the national value.
Trend
This comparison measures the indicator’s values over multiple time periods.<br>The Mann-Kendall Test for Statistical Significance is used to evaluate the trend<br>over 4 to 10 periods of measure, subject to data availability and comparability.
County: Klamath Families Living Below Poverty Level
County: Klamath Families Living Below Poverty Level
11.8%
(2018-2022)
Compared to:
OR Counties
The distribution is based on data from 36 Oregon counties.
U.S. Counties
The distribution is based on data from 3,104 U.S. counties and county equivalents.
OR Value
(7.3%)
The regional value is compared to the Oregon State value.
US Value
(8.8%)
The regional value is compared to the national value.
Trend
This comparison measures the indicator’s values over multiple time periods.<br>The Mann-Kendall Test for Statistical Significance is used to evaluate the trend<br>over 4 to 10 periods of measure, subject to data availability and comparability.
County: Klamath Households Living Below Poverty Level
County: Klamath Households Living Below Poverty Level
20.4%
(2021)
Compared to:
OR Counties
The distribution is based on data from 36 Oregon counties.
OR Value
(12.0%)
The regional value is compared to the Oregon State value.
Prior Value
(18.7%)
Prior Value compares a measured value with the previously measured value. Confidence intervals were not taken into account in determining the direction of the comparison.
County: Klamath People 65+ Living Below Poverty Level
County: Klamath People 65+ Living Below Poverty Level
12.4%
(2018-2022)
Compared to:
OR Counties
The distribution is based on data from 36 Oregon counties.
U.S. Counties
The distribution is based on data from 3,133 U.S. counties and county equivalents.
OR Value
(8.8%)
The regional value is compared to the Oregon State value.
US Value
(10.0%)
The regional value is compared to the national value.
Trend
This comparison measures the indicator’s values over multiple time periods.<br>The Mann-Kendall Test for Statistical Significance is used to evaluate the trend<br>over 4 to 10 periods of measure, subject to data availability and comparability.
County: Klamath People 65+ Living Below Poverty Level (Count)
County: Klamath People 65+ Living Below Poverty Level (Count)
1,844
People
(2018-2022)
Compared to:
Trend
This comparison measures the indicator’s values over multiple time periods.<br>The Mann-Kendall Test for Statistical Significance is used to evaluate the trend<br>over 4 to 10 periods of measure, subject to data availability and comparability.
County: Klamath People Living 200% Above Poverty Level
County: Klamath People Living 200% Above Poverty Level
60.2%
(2018-2022)
Compared to:
OR Counties
The distribution is based on data from 36 Oregon counties.
U.S. Counties
The distribution is based on data from 3,133 U.S. counties and county equivalents.
OR Value
(71.9%)
The regional value is compared to the Oregon State value.
US Value
(71.2%)
The regional value is compared to the national value.
Trend
This comparison measures the indicator’s values over multiple time periods.<br>The Mann-Kendall Test for Statistical Significance is used to evaluate the trend<br>over 4 to 10 periods of measure, subject to data availability and comparability.
County: Klamath People Living Below Poverty Level
County: Klamath People Living Below Poverty Level
17.8%
(2018-2022)
Compared to:
OR Counties
The distribution is based on data from 36 Oregon counties.
U.S. Counties
The distribution is based on data from 3,133 U.S. counties and county equivalents.
OR Value
(11.9%)
The regional value is compared to the Oregon State value.
US Value
(12.5%)
The regional value is compared to the national value.
Trend
This comparison measures the indicator’s values over multiple time periods.<br>The Mann-Kendall Test for Statistical Significance is used to evaluate the trend<br>over 4 to 10 periods of measure, subject to data availability and comparability.
HP 2030 Target
(8.0%)
County: Klamath Youth not in School or Working
County: Klamath Youth not in School or Working
3.2%
(2018-2022)
Compared to:
OR Counties
The distribution is based on data from 36 Oregon counties.
U.S. Counties
The distribution is based on data from 3,130 U.S. counties and county equivalents.
OR Value
(2.2%)
The regional value is compared to the Oregon State value.
US Value
(1.8%)
The regional value is compared to the national value.
Trend
This comparison measures the indicator’s values over multiple time periods.<br>The Mann-Kendall Test for Statistical Significance is used to evaluate the trend<br>over 4 to 10 periods of measure, subject to data availability and comparability.
County: Klamath
Education / Childcare & Early Childhood Education
Value
Compared to:
County: Klamath Child Care Centers
County: Klamath Child Care Centers
5.9
Per 1,000 population under age 5
(2022)
Compared to:
OR Counties
The distribution is based on data from 36 Oregon counties.
OR Value
(8.5)
The regional value is compared to the Oregon State value.
US Value
(7.0)
The regional value is compared to the national value.
Prior Value
(3.7)
Prior Value compares a measured value with the previously measured value. Confidence intervals were not taken into account in determining the direction of the comparison.
County: Klamath
Education / Educational Attainment
Value
Compared to:
County: Klamath People 25+ with a Bachelor's Degree or Higher
County: Klamath People 25+ with a Bachelor's Degree or Higher
20.8%
(2018-2022)
Compared to:
OR Counties
The distribution is based on data from 36 Oregon counties.
U.S. Counties
The distribution is based on data from 3,133 U.S. counties and county equivalents.
OR Value
(35.5%)
The regional value is compared to the Oregon State value.
US Value
(34.3%)
The regional value is compared to the national value.
Trend
This comparison measures the indicator’s values over multiple time periods.<br>The Mann-Kendall Test for Statistical Significance is used to evaluate the trend<br>over 4 to 10 periods of measure, subject to data availability and comparability.
County: Klamath People 25+ with a High School Diploma or Higher
County: Klamath People 25+ with a High School Diploma or Higher
89.3%
(2018-2022)
Compared to:
OR Counties
The distribution is based on data from 36 Oregon counties.
U.S. Counties
The distribution is based on data from 3,133 U.S. counties and county equivalents.
OR Value
(91.6%)
The regional value is compared to the Oregon State value.
US Value
(89.1%)
The regional value is compared to the national value.
Trend
This comparison measures the indicator’s values over multiple time periods.<br>The Mann-Kendall Test for Statistical Significance is used to evaluate the trend<br>over 4 to 10 periods of measure, subject to data availability and comparability.
County: Klamath
Education / School Environment
Value
Compared to:
County: Klamath Student-to-Teacher Ratio
County: Klamath Student-to-Teacher Ratio
18.0
Students per teacher
(2022-2023)
Compared to:
OR Counties
The distribution is based on data from 36 Oregon counties.
U.S. Counties
The distribution is based on data from 3,125 U.S. counties and county equivalents.
OR Value
(17.9)
The regional value is compared to the Oregon State value.
US Value
(15.4)
The regional value is compared to the national value.
Prior Value
(18.9)
Prior Value compares a measured value with the previously measured value. Confidence intervals were not taken into account in determining the direction of the comparison.
Trend
This comparison measures the indicator’s values over multiple time periods.<br>The Mann-Kendall Test for Statistical Significance is used to evaluate the trend<br>over 4 to 10 periods of measure, subject to data availability and comparability.
County: Klamath
Education / Student Performance K-12
Value
Compared to:
County: Klamath 3rd Grade Students Proficient in Math
County: Klamath 3rd Grade Students Proficient in Math
44.5%
(2018-2019)
Compared to:
OR Counties
The distribution is based on data from 36 Oregon counties.
OR Value
(46.4%)
The regional value is compared to the Oregon State value.
Prior Value
(43.0%)
Prior Value compares a measured value with the previously measured value. Confidence intervals were not taken into account in determining the direction of the comparison.
Blue Zones 2021
(85%)
County: Klamath 3rd Grade Students Proficient in Reading
County: Klamath 3rd Grade Students Proficient in Reading
38.1%
(2018-2019)
Compared to:
OR Counties
The distribution is based on data from 36 Oregon counties.
OR Value
(46.5%)
The regional value is compared to the Oregon State value.
Prior Value
(39.7%)
Prior Value compares a measured value with the previously measured value. Confidence intervals were not taken into account in determining the direction of the comparison.
Blue Zones 2021
(80%)
County: Klamath 8th Grade Students Proficient in Math
County: Klamath 8th Grade Students Proficient in Math
31.6%
(2018-2019)
Compared to:
OR Counties
The distribution is based on data from 36 Oregon counties.
OR Value
(38.3%)
The regional value is compared to the Oregon State value.
Prior Value
(32.3%)
Prior Value compares a measured value with the previously measured value. Confidence intervals were not taken into account in determining the direction of the comparison.
Trend
This comparison measures the indicator’s values over multiple time periods.<br>The Mann-Kendall Test for Statistical Significance is used to evaluate the trend<br>over 4 to 10 periods of measure, subject to data availability and comparability.
County: Klamath 8th Grade Students Proficient in Reading
County: Klamath 8th Grade Students Proficient in Reading
49.0%
(2018-2019)
Compared to:
OR Counties
The distribution is based on data from 36 Oregon counties.
OR Value
(53.2%)
The regional value is compared to the Oregon State value.
Prior Value
(49.8%)
Prior Value compares a measured value with the previously measured value. Confidence intervals were not taken into account in determining the direction of the comparison.
Trend
This comparison measures the indicator’s values over multiple time periods.<br>The Mann-Kendall Test for Statistical Significance is used to evaluate the trend<br>over 4 to 10 periods of measure, subject to data availability and comparability.
County: Klamath High School Drop Outs
County: Klamath High School Drop Outs
1.6%
(2022-2023)
Compared to:
OR Counties
The distribution is based on data from 36 Oregon counties.
OR Value
(3.3%)
The regional value is compared to the Oregon State value.
Prior Value
(5.9%)
Prior Value compares a measured value with the previously measured value. Confidence intervals were not taken into account in determining the direction of the comparison.
Trend
This comparison measures the indicator’s values over multiple time periods.<br>The Mann-Kendall Test for Statistical Significance is used to evaluate the trend<br>over 4 to 10 periods of measure, subject to data availability and comparability.
County: Klamath High School Graduation
County: Klamath High School Graduation
76.4%
(2021)
Compared to:
Prior Value
(80.3%)
Prior Value compares a measured value with the previously measured value. Confidence intervals were not taken into account in determining the direction of the comparison.
Trend
This comparison measures the indicator’s values over multiple time periods.<br>The Mann-Kendall Test for Statistical Significance is used to evaluate the trend<br>over 4 to 10 periods of measure, subject to data availability and comparability.
HP 2030 Target
(90.7%)
County: Klamath
Environmental Health / Air
Value
Compared to:
County: Klamath Annual Particle Pollution
County: Klamath Annual Particle Pollution
5
(2019-2021)
Compared to:
Air Quality Index
The American Lung Association (ALA) assigns grades A-F to counties (A=1; B=2; C=3; D=4; F=5), based on average annual number of days that particle pollution levels exceeded U.S. standards during the three year measurement period. The five-point grading scale was used for the distribution (Green = <2; Yellow = 2 - 3; Red = >3). The air quality data is collected by the EPA and summarized by the ALA.
Prior Value
(5)
Prior Value compares a measured value with the previously measured value. Confidence intervals were not taken into account in determining the direction of the comparison.
Trend
This comparison measures the indicator’s values over multiple time periods.<br>The Mann-Kendall Test for Statistical Significance is used to evaluate the trend<br>over 4 to 10 periods of measure, subject to data availability and comparability.
County: Klamath Recognized Carcinogens Released into Air
County: Klamath Recognized Carcinogens Released into Air
21,565
Pounds
(2022)
Compared to:
Prior Value
(19,158)
Prior Value compares a measured value with the previously measured value. Confidence intervals were not taken into account in determining the direction of the comparison.
Trend
This comparison measures the indicator’s values over multiple time periods.<br>The Mann-Kendall Test for Statistical Significance is used to evaluate the trend<br>over 4 to 10 periods of measure, subject to data availability and comparability.
County: Klamath
Environmental Health / Built Environment
Value
Compared to:
County: Klamath Access to Exercise Opportunities
County: Klamath Access to Exercise Opportunities
74.6%
(2024)
Compared to:
OR Counties
The distribution is based on data from 36 Oregon counties.
U.S. Counties
The distribution is based on data from 3,096 U.S. counties and county equivalents.
OR Value
(87.7%)
The regional value is compared to the Oregon State value.
US Value
(84.1%)
The regional value is compared to the national value.
Prior Value
(73.7%)
Prior Value compares a measured value with the previously measured value. Confidence intervals were not taken into account in determining the direction of the comparison.
County: Klamath Access to Parks
County: Klamath Access to Parks
0.6%
(2020)
Compared to:
OR Counties
The distribution is based on data from 36 Oregon counties.
OR Value
(80.3%)
The regional value is compared to the Oregon State value.
Prior Value
(0.4%)
Prior Value compares a measured value with the previously measured value. Confidence intervals were not taken into account in determining the direction of the comparison.
County: Klamath Food Environment Index
County: Klamath Food Environment Index
6.6
(2024)
Compared to:
OR Counties
The distribution is based on data from 36 Oregon counties.
U.S. Counties
The distribution is based on data from 3,108 U.S. counties and county equivalents.
OR Value
(8.1)
The regional value is compared to the Oregon State value.
US Value
(7.7)
The regional value is compared to the national value.
Prior Value
(6.5)
Prior Value compares a measured value with the previously measured value. Confidence intervals were not taken into account in determining the direction of the comparison.
Trend
This comparison measures the indicator’s values over multiple time periods.<br>The Mann-Kendall Test for Statistical Significance is used to evaluate the trend<br>over 4 to 10 periods of measure, subject to data availability and comparability.
County: Klamath Liquor Store Density
County: Klamath Liquor Store Density
4.3
Stores per 100,000 population
(2021)
Compared to:
OR Counties
The distribution is based on data from 21 Oregon counties.
U.S. Counties
The distribution is based on data from 1,477 U.S. counties and county equivalents.
OR Value
(5.7)
The regional value is compared to the Oregon State value.
US Value
(10.7)
The regional value is compared to the national value.
Prior Value
(3.0)
Prior Value compares a measured value with the previously measured value. Confidence intervals were not taken into account in determining the direction of the comparison.
Trend
This comparison measures the indicator’s values over multiple time periods.<br>The Mann-Kendall Test for Statistical Significance is used to evaluate the trend<br>over 4 to 10 periods of measure, subject to data availability and comparability.
County: Klamath Proximity to Highways
County: Klamath Proximity to Highways
0.0%
(2020)
Compared to:
OR Value
(0.1%)
The regional value is compared to the Oregon State value.
Prior Value
(0.0%)
Prior Value compares a measured value with the previously measured value. Confidence intervals were not taken into account in determining the direction of the comparison.
County: Klamath
Environmental Health / Toxins & Contaminants
Value
Compared to:
County: Klamath Houses Built Prior to 1950
County: Klamath Houses Built Prior to 1950
23.0%
(2018-2022)
Compared to:
OR Counties
The distribution is based on data from 36 Oregon counties.
U.S. Counties
The distribution is based on data from 3,133 U.S. counties and county equivalents.
OR Value
(16.0%)
The regional value is compared to the Oregon State value.
US Value
(16.7%)
The regional value is compared to the national value.
Trend
This comparison measures the indicator’s values over multiple time periods.<br>The Mann-Kendall Test for Statistical Significance is used to evaluate the trend<br>over 4 to 10 periods of measure, subject to data availability and comparability.
County: Klamath PBT Released
County: Klamath PBT Released
443
Pounds
(2022)
Compared to:
Prior Value
(465)
Prior Value compares a measured value with the previously measured value. Confidence intervals were not taken into account in determining the direction of the comparison.
Trend
This comparison measures the indicator’s values over multiple time periods.<br>The Mann-Kendall Test for Statistical Significance is used to evaluate the trend<br>over 4 to 10 periods of measure, subject to data availability and comparability.
County: Klamath
Environmental Health / Weather & Climate
Value
Compared to:
County: Klamath Daily Dose of UV Irradiance
County: Klamath Daily Dose of UV Irradiance
3,955.0
Joule per square meter
(2020)
Compared to:
OR Counties
The distribution is based on data from 36 Oregon counties.
OR Value
(3,607.0)
The regional value is compared to the Oregon State value.
Prior Value
(3,356.0)
Prior Value compares a measured value with the previously measured value. Confidence intervals were not taken into account in determining the direction of the comparison.
Trend
This comparison measures the indicator’s values over multiple time periods.<br>The Mann-Kendall Test for Statistical Significance is used to evaluate the trend<br>over 4 to 10 periods of measure, subject to data availability and comparability.
County: Klamath Months of Mild Drought or Worse
County: Klamath Months of Mild Drought or Worse
7
Months per year
(2016)
Compared to:
Prior Value
(9)
Prior Value compares a measured value with the previously measured value. Confidence intervals were not taken into account in determining the direction of the comparison.
Trend
This comparison measures the indicator’s values over multiple time periods.<br>The Mann-Kendall Test for Statistical Significance is used to evaluate the trend<br>over 4 to 10 periods of measure, subject to data availability and comparability.
County: Klamath Number of Extreme Heat Days
County: Klamath Number of Extreme Heat Days
22
Days
(2022)
Compared to:
Prior Value
(39)
Prior Value compares a measured value with the previously measured value. Confidence intervals were not taken into account in determining the direction of the comparison.
Trend
This comparison measures the indicator’s values over multiple time periods.<br>The Mann-Kendall Test for Statistical Significance is used to evaluate the trend<br>over 4 to 10 periods of measure, subject to data availability and comparability.
County: Klamath Number of Extreme Heat Events
County: Klamath Number of Extreme Heat Events
19
Events
(2022)
Compared to:
Prior Value
(36)
Prior Value compares a measured value with the previously measured value. Confidence intervals were not taken into account in determining the direction of the comparison.
Trend
This comparison measures the indicator’s values over multiple time periods.<br>The Mann-Kendall Test for Statistical Significance is used to evaluate the trend<br>over 4 to 10 periods of measure, subject to data availability and comparability.
County: Klamath Number of Extreme Precipitation Days
County: Klamath Number of Extreme Precipitation Days
2
Days
(2023)
Compared to:
Prior Value
(24)
Prior Value compares a measured value with the previously measured value. Confidence intervals were not taken into account in determining the direction of the comparison.
Trend
This comparison measures the indicator’s values over multiple time periods.<br>The Mann-Kendall Test for Statistical Significance is used to evaluate the trend<br>over 4 to 10 periods of measure, subject to data availability and comparability.
County: Klamath Weeks of Moderate Drought or Worse
County: Klamath Weeks of Moderate Drought or Worse
47
Weeks per year
(2021)
Compared to:
Prior Value
(44)
Prior Value compares a measured value with the previously measured value. Confidence intervals were not taken into account in determining the direction of the comparison.
Trend
This comparison measures the indicator’s values over multiple time periods.<br>The Mann-Kendall Test for Statistical Significance is used to evaluate the trend<br>over 4 to 10 periods of measure, subject to data availability and comparability.
