Search for Indicators
Physical Activity
Indicator Gauge Icon Legend
Legend Colors
Red is bad, green is good, blue is not statistically different/neutral.
Compared to Distribution
 the value is in the best half of communities.
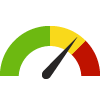
 the value is in the 2nd worst quarter of communities.
 the value is in the worst quarter of communities.
Compared to Target
 meets target;
  does not meet target.
Compared to a Single Value
 lower than the comparison value;
 higher than the comparison value;
 not statistically different from comparison value.
Trend

 non-significant change over time;
 significant change over time;
  no change over time.
Compared to Prior Value
 higher than the previous measurement period;
 lower than the previous measurement period;
 no statistically different change from previous measurement period.
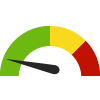
Adults Engaging in Regular Physical Activity
Value
Compared to:
Adults Engaging in Regular Physical Activity County: Klamath
Adults Engaging in Regular Physical Activity County: Klamath
19.6%
(2014-2017)
Compared to:


OR Counties
The distribution is based on data from 28 Oregon counties.
OR Value
(22.7%)
The regional value is compared to the Oregon State value.
Prior Value
(25.4%)
Prior Value compares a measured value with the previously measured value. Confidence intervals were not taken into account in determining the direction of the comparison.
HP 2030 Target
(29.7%)
<div>PA-05: Increase the proportion of adults who do enough aerobic and muscle-strengthening activity <strong>(LEADING HEALTH INDICATOR)</strong></div>
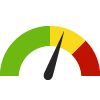
Well-Being Index Community Score
Value
Compared to:
Well-Being Index Community Score County: Klamath
Well-Being Index Community Score County: Klamath
54.9
Index Score
(2018)
Compared to:
OR Value
(59.1 in 2017)
The regional value is compared to the Oregon State value.
US Value
(58.5 in 2017)
The regional value is compared to the national value.
Prior Value
(52.3)
Prior Value compares a measured value with the previously measured value. Confidence intervals were not taken into account in determining the direction of the comparison.
Trend
This comparison measures the indicator’s values over multiple time periods.<br>The Mann-Kendall Test for Statistical Significance is used to evaluate the trend<br>over 4 to 10 periods of measure, subject to data availability and comparability.
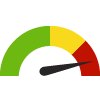
Well-Being Index Physical Score
Value
Compared to:
Well-Being Index Physical Score County: Klamath
Well-Being Index Physical Score County: Klamath
58.2
Index Score
(2018)
Compared to:

OR Value
(57.6 in 2017)
The regional value is compared to the Oregon State value.
US Value
(57.5 in 2017)
The regional value is compared to the national value.
Prior Value
(60.1)
Prior Value compares a measured value with the previously measured value. Confidence intervals were not taken into account in determining the direction of the comparison.
Trend
This comparison measures the indicator’s values over multiple time periods.<br>The Mann-Kendall Test for Statistical Significance is used to evaluate the trend<br>over 4 to 10 periods of measure, subject to data availability and comparability.
Well-Being Index Social Score
Value
Compared to:
Well-Being Index Social Score County: Klamath
Well-Being Index Social Score County: Klamath
64.4
Index Score
(2018)
Compared to:

OR Value
(62.1 in 2017)
The regional value is compared to the Oregon State value.
US Value
(62.7 in 2017)
The regional value is compared to the national value.
Prior Value
(63.9)
Prior Value compares a measured value with the previously measured value. Confidence intervals were not taken into account in determining the direction of the comparison.
Trend
This comparison measures the indicator’s values over multiple time periods.<br>The Mann-Kendall Test for Statistical Significance is used to evaluate the trend<br>over 4 to 10 periods of measure, subject to data availability and comparability.
