Search for Indicators
Substance Use
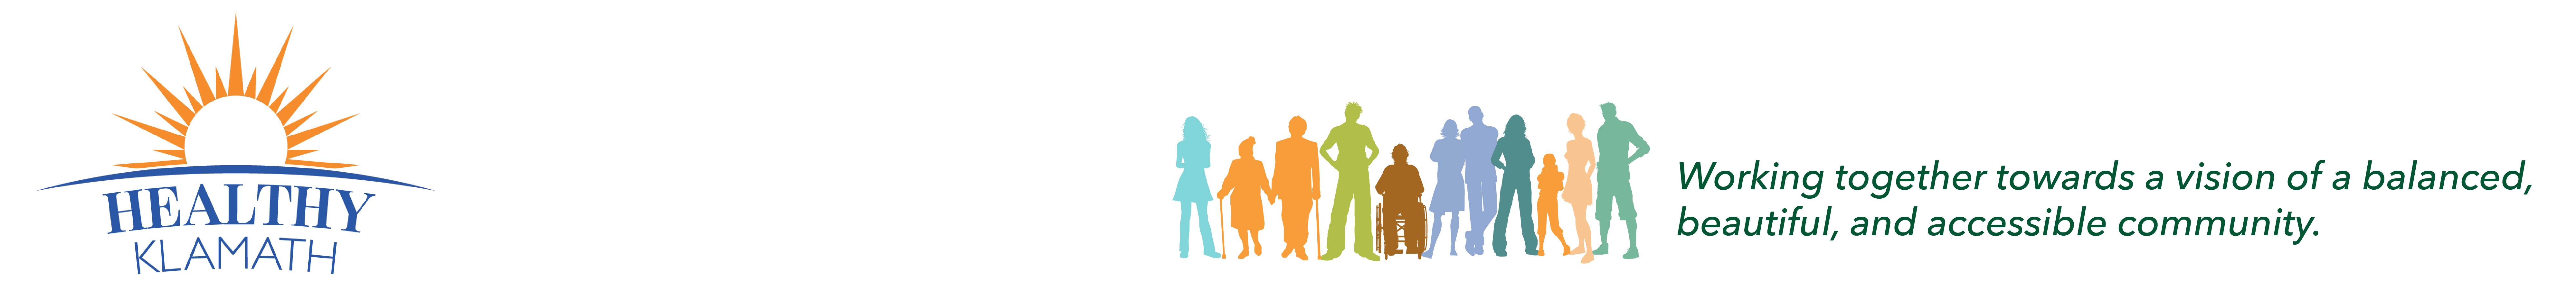
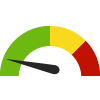
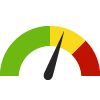
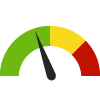
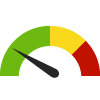
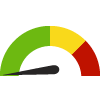
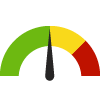
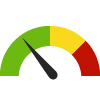
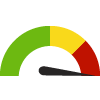
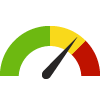
Indicator Gauge Icon Legend
Legend Colors
Red is bad, green is good, blue is not statistically different/neutral.
Compared to Distribution
 the value is in the best half of communities.
 the value is in the 2nd worst quarter of communities.
 the value is in the worst quarter of communities.
Compared to Target
 meets target;
  does not meet target.
Compared to a Single Value
 lower than the comparison value;
 higher than the comparison value;
 not statistically different from comparison value.
Trend

 non-significant change over time;
 significant change over time;
  no change over time.
Compared to Prior Value
 higher than the previous measurement period;
 lower than the previous measurement period;
 no statistically different change from previous measurement period.
Adults who Binge Drink
Value
Compared to:
Adults who Binge Drink County: Klamath
Adults who Binge Drink County: Klamath
14.0%
(2021)
Compared to:
OR Counties
The distribution is based on data from 36 Oregon counties.
U.S. Counties
The distribution is based on data from 3,074 U.S. counties and county equivalents.
US Value
(15.5%)
The regional value is compared to the national value.
Adults who Binge Drink: Females
Value
Compared to:
Adults who Binge Drink: Females County: Klamath
Adults who Binge Drink: Females County: Klamath
9.4%
(2014-2017)
Compared to:
OR Counties
The distribution is based on data from 28 Oregon counties.
OR Value
(14.3%)
The regional value is compared to the Oregon State value.
Prior Value
(9.4%)
Prior Value compares a measured value with the previously measured value. Confidence intervals were taken into account in determining the direction of the comparison.
Trend
This comparison measures the indicator’s values over multiple time periods.<br>The Mann-Kendall Test for Statistical Significance is used to evaluate the trend<br>over 4 to 10 periods of measure, subject to data availability and comparability.
Healthy Klamath Target
(5.0%)
Adults who Binge Drink: Males
Value
Compared to:
Adults who Binge Drink: Males County: Klamath
Adults who Binge Drink: Males County: Klamath
18.2%
(2014-2017)
Compared to:

OR Counties
The distribution is based on data from 30 Oregon counties.
OR Value
(22.3%)
The regional value is compared to the Oregon State value.
Prior Value
(15.4%)
Prior Value compares a measured value with the previously measured value. Confidence intervals were taken into account in determining the direction of the comparison.
Trend
This comparison measures the indicator’s values over multiple time periods.<br>The Mann-Kendall Test for Statistical Significance is used to evaluate the trend<br>over 4 to 10 periods of measure, subject to data availability and comparability.
Healthy Klamath Target
(12.0%)
Students who Binge Drink: 11th Graders
Value
Compared to:
Students who Binge Drink: 11th Graders County: Klamath
Students who Binge Drink: 11th Graders County: Klamath
6.2%
(2020)
Compared to:
OR Counties
(2019)
The distribution is based on data from 33 Oregon counties.
OR Value
(7.3%)
The regional value is compared to the Oregon State value.
Prior Value
(6.5%)
Prior Value compares a measured value with the previously measured value. Confidence intervals were not taken into account in determining the direction of the comparison.
Trend
This comparison measures the indicator’s values over multiple time periods.<br>The Mann-Kendall Test for Statistical Significance is used to evaluate the trend<br>over 4 to 10 periods of measure, subject to data availability and comparability.
Students who Binge Drink: 8th Graders
Value
Compared to:
Students who Binge Drink: 8th Graders County: Klamath
Students who Binge Drink: 8th Graders County: Klamath
2.2%
(2020)
Compared to:
OR Counties
(2019)
The distribution is based on data from 33 Oregon counties.
OR Value
(2.3%)
The regional value is compared to the Oregon State value.
Prior Value
(10.8%)
Prior Value compares a measured value with the previously measured value. Confidence intervals were not taken into account in determining the direction of the comparison.
Trend
This comparison measures the indicator’s values over multiple time periods.<br>The Mann-Kendall Test for Statistical Significance is used to evaluate the trend<br>over 4 to 10 periods of measure, subject to data availability and comparability.
Students who Use Alcohol: 11th Graders
Value
Compared to:
Students who Use Alcohol: 11th Graders County: Klamath
Students who Use Alcohol: 11th Graders County: Klamath
12.7%
(2020)
Compared to:
OR Counties
(2019)
The distribution is based on data from 33 Oregon counties.
OR Value
(17.0%)
The regional value is compared to the Oregon State value.
Prior Value
(13.9%)
Prior Value compares a measured value with the previously measured value. Confidence intervals were not taken into account in determining the direction of the comparison.
Trend
This comparison measures the indicator’s values over multiple time periods.<br>The Mann-Kendall Test for Statistical Significance is used to evaluate the trend<br>over 4 to 10 periods of measure, subject to data availability and comparability.
Students who Use Alcohol: 8th Graders
Value
Compared to:
Students who Use Alcohol: 8th Graders County: Klamath
Students who Use Alcohol: 8th Graders County: Klamath
5.2%
(2020)
Compared to:
OR Counties
(2019)
The distribution is based on data from 33 Oregon counties.
OR Value
(6.1%)
The regional value is compared to the Oregon State value.
Prior Value
(16.9%)
Prior Value compares a measured value with the previously measured value. Confidence intervals were not taken into account in determining the direction of the comparison.
Trend
This comparison measures the indicator’s values over multiple time periods.<br>The Mann-Kendall Test for Statistical Significance is used to evaluate the trend<br>over 4 to 10 periods of measure, subject to data availability and comparability.
Age-Adjusted Death Rate due to Alcohol Consumption
Value
Compared to:
Age-Adjusted Death Rate due to Alcohol Consumption County: Klamath
Age-Adjusted Death Rate due to Alcohol Consumption County: Klamath
70.8
Deaths per 100,000 population
(2017-2020)
Compared to:


OR Value
(45.4)
The regional value is compared to the Oregon State value.
Prior Value
(67.5)
Prior Value compares a measured value with the previously measured value. Confidence intervals were not taken into account in determining the direction of the comparison.
Trend
This comparison measures the indicator’s values over multiple time periods.<br>The Mann-Kendall Test for Statistical Significance is used to evaluate the trend<br>over 4 to 10 periods of measure, subject to data availability and comparability.
Alcohol-Impaired Driving Deaths
Value
Compared to:
Alcohol-Impaired Driving Deaths County: Klamath
Alcohol-Impaired Driving Deaths County: Klamath
25.3%
Percent of driving deaths with alcohol involvement
(2017-2021)
Compared to:
OR Counties
The distribution is based on data from 36 Oregon counties.
U.S. Counties
The distribution is based on data from 3,116 U.S. counties and county equivalents.
OR Value
(27.4%)
The regional value is compared to the Oregon State value.
US Value
(26.3%)
The regional value is compared to the national value.
Prior Value
(25.3%)
Prior Value compares a measured value with the previously measured value. Confidence intervals were taken into account in determining the direction of the comparison.
Trend
This comparison measures the indicator’s values over multiple time periods.<br>The Mann-Kendall Test for Statistical Significance is used to evaluate the trend<br>over 4 to 10 periods of measure, subject to data availability and comparability.
Hospital Admission Rate due to Drug Overdose
Value
Compared to:
Hospital Admission Rate due to Drug Overdose County: Klamath
Hospital Admission Rate due to Drug Overdose County: Klamath
82.8
Admissions per 100,000 population
(2018)
Compared to:
OR Counties
(2017)
The distribution is based on data from 31 Oregon counties.
OR Value
(97.0)
The regional value is compared to the Oregon State value.
Prior Value
(115.0)
Prior Value compares a measured value with the previously measured value. Confidence intervals were not taken into account in determining the direction of the comparison.
Trend
This comparison measures the indicator’s values over multiple time periods.<br>The Mann-Kendall Test for Statistical Significance is used to evaluate the trend<br>over 4 to 10 periods of measure, subject to data availability and comparability.
Age-Adjusted Drug and Opioid-Involved Overdose Death Rate
Value
Compared to:
Age-Adjusted Drug and Opioid-Involved Overdose Death Rate County: Klamath
Age-Adjusted Drug and Opioid-Involved Overdose Death Rate County: Klamath
20.4
Deaths per 100,000 population
(2018-2020)
Compared to:
U.S. Counties
The distribution is based on data from 1,303 U.S. counties and county equivalents.
OR Value
(15.1)
The regional value is compared to the Oregon State value.
US Value
(23.5)
The regional value is compared to the national value.
Prior Value
(23.9)
Prior Value compares a measured value with the previously measured value. Confidence intervals were taken into account in determining the direction of the comparison.
Death Rate due to All Drug Overdose
Value
Compared to:
Death Rate due to All Drug Overdose County: Klamath
Death Rate due to All Drug Overdose County: Klamath
9.7
Deaths per 100,000 population
(2013-2017)
Compared to:
OR Counties
The distribution is based on data from 31 Oregon counties.
OR Value
(9.7)
The regional value is compared to the Oregon State value.
Prior Value
(10.0)
Prior Value compares a measured value with the previously measured value. Confidence intervals were not taken into account in determining the direction of the comparison.
Death Rate due to Methamphetamine and Psychostimulant Overdose
Value
Compared to:
Death Rate due to Methamphetamine and Psychostimulant Overdose County: Klamath
Death Rate due to Methamphetamine and Psychostimulant Overdose County: Klamath
6.5
Deaths per 100,000
(2015-2017)
Compared to:
OR Value
(3.4)
The regional value is compared to the Oregon State value.
Prior Value
(0.0)
Prior Value compares a measured value with the previously measured value. Confidence intervals were not taken into account in determining the direction of the comparison.
Death Rate due to Drug Poisoning
Value
Compared to:
Death Rate due to Drug Poisoning County: Klamath
Death Rate due to Drug Poisoning County: Klamath
27.0
Deaths per 100,000 population
(2019-2021)
Compared to:
OR Counties
The distribution is based on data from 27 Oregon counties.
U.S. Counties
The distribution is based on data from 1,899 U.S. counties and county equivalents.
OR Value
(20.4)
The regional value is compared to the Oregon State value.
US Value
(27.2)
The regional value is compared to the national value.
HP 2030 Target
(20.7)
<div>SU-03: Reduce drug overdose deaths <strong>(LEADING HEALTH INDICATOR)</strong></div>
Death due to Opioid Overdose
Value
Compared to:
Death due to Opioid Overdose County: Klamath
Death due to Opioid Overdose County: Klamath
4.9
Deaths per 100,000 population
(2013-2017)
Compared to:
OR Counties
The distribution is based on data from 26 Oregon counties.
OR Value
(6.8)
The regional value is compared to the Oregon State value.
Prior Value
(8.1)
Prior Value compares a measured value with the previously measured value. Confidence intervals were not taken into account in determining the direction of the comparison.
Students who Use Marijuana: 11th Graders
Value
Compared to:
Students who Use Marijuana: 11th Graders County: Klamath
Students who Use Marijuana: 11th Graders County: Klamath
10.4%
(2020)
Compared to:
OR Counties
(2019)
The distribution is based on data from 28 Oregon counties.
OR Value
(13.5%)
The regional value is compared to the Oregon State value.
Prior Value
(9.3%)
Prior Value compares a measured value with the previously measured value. Confidence intervals were not taken into account in determining the direction of the comparison.
Trend
This comparison measures the indicator’s values over multiple time periods.<br>The Mann-Kendall Test for Statistical Significance is used to evaluate the trend<br>over 4 to 10 periods of measure, subject to data availability and comparability.
Students who Use Marijuana: 8th Graders
Value
Compared to:
Students who Use Marijuana: 8th Graders County: Klamath
Students who Use Marijuana: 8th Graders County: Klamath
6.2%
(2020)
Compared to:
OR Counties
(2019)
The distribution is based on data from 28 Oregon counties.
OR Value
(3.3%)
The regional value is compared to the Oregon State value.
Prior Value
(10.8%)
Prior Value compares a measured value with the previously measured value. Confidence intervals were not taken into account in determining the direction of the comparison.
Trend
This comparison measures the indicator’s values over multiple time periods.<br>The Mann-Kendall Test for Statistical Significance is used to evaluate the trend<br>over 4 to 10 periods of measure, subject to data availability and comparability.
11th Grade Students Who Report Vaping or Using E-Cigarettes
Value
Compared to:
11th Grade Students Who Report Vaping or Using E-Cigarettes County: Klamath
11th Grade Students Who Report Vaping or Using E-Cigarettes County: Klamath
12.2%
(2020)
Compared to:
OR Counties
(2019)
The distribution is based on data from 28 Oregon counties.
OR Value
(11.9%)
The regional value is compared to the Oregon State value.
Prior Value
(10.3%)
Prior Value compares a measured value with the previously measured value. Confidence intervals were not taken into account in determining the direction of the comparison.
Trend
This comparison measures the indicator’s values over multiple time periods.<br>The Mann-Kendall Test for Statistical Significance is used to evaluate the trend<br>over 4 to 10 periods of measure, subject to data availability and comparability.
8th Grade Students Who Report Vaping or Using E-Cigarettes
Value
Compared to:
8th Grade Students Who Report Vaping or Using E-Cigarettes County: Klamath
8th Grade Students Who Report Vaping or Using E-Cigarettes County: Klamath
8.0%
(2020)
Compared to:
OR Counties
(2019)
The distribution is based on data from 28 Oregon counties.
OR Value
(5.1%)
The regional value is compared to the Oregon State value.
Prior Value
(9.3%)
Prior Value compares a measured value with the previously measured value. Confidence intervals were not taken into account in determining the direction of the comparison.
Trend
This comparison measures the indicator’s values over multiple time periods.<br>The Mann-Kendall Test for Statistical Significance is used to evaluate the trend<br>over 4 to 10 periods of measure, subject to data availability and comparability.
Students who Use Non-Cigarette Tobacco
Value
Compared to:
Students who Use Non-Cigarette Tobacco County: Klamath
Students who Use Non-Cigarette Tobacco County: Klamath
17.2%
(2020)
Compared to:
OR Counties
(2019)
The distribution is based on data from 28 Oregon counties.
OR Value
(16.1%)
The regional value is compared to the Oregon State value.
Prior Value
(5.0%)
Prior Value compares a measured value with the previously measured value. Confidence intervals were not taken into account in determining the direction of the comparison.
Trend
This comparison measures the indicator’s values over multiple time periods.<br>The Mann-Kendall Test for Statistical Significance is used to evaluate the trend<br>over 4 to 10 periods of measure, subject to data availability and comparability.
Adults who Smoke
Value
Compared to:
Adults who Smoke County: Klamath
Adults who Smoke County: Klamath
17.8%
(2021)
Compared to:
OR Counties
The distribution is based on data from 36 Oregon counties.
U.S. Counties
The distribution is based on data from 3,074 U.S. counties and county equivalents.
US Value
(13.5%)
The regional value is compared to the national value.
HP 2030 Target
(6.1%)
<div>TU-02: Reduce current cigarette smoking in adults <strong>(LEADING HEALTH INDICATOR)</strong></div>
Healthy Klamath Target
(18.0%)
Mothers who Smoked During Pregnancy
Value
Compared to:
Mothers who Smoked During Pregnancy County: Klamath
Mothers who Smoked During Pregnancy County: Klamath
12.0%
(2021)
Compared to:
OR Counties
The distribution is based on data from 33 Oregon counties.
OR Value
(5.6%)
The regional value is compared to the Oregon State value.
US Value
(4.6%)
The regional value is compared to the national value. The source for the national value is Centers for Disease Control and Prevention
Prior Value
(12.2%)
Prior Value compares a measured value with the previously measured value. Confidence intervals were not taken into account in determining the direction of the comparison.
Trend
This comparison measures the indicator’s values over multiple time periods.<br>The Mann-Kendall Test for Statistical Significance is used to evaluate the trend<br>over 4 to 10 periods of measure, subject to data availability and comparability.
HP 2030 Target
(4.3%)
Healthy Klamath Target
(14.6%)
Tobacco-Linked Death Rate
Value
Compared to:
Tobacco-Linked Death Rate County: Klamath
Tobacco-Linked Death Rate County: Klamath
29.6%
(2021)
Compared to:
OR Counties
(2017)
The distribution is based on data from 36 Oregon counties.
OR Value
(18.9%)
The regional value is compared to the Oregon State value.
Prior Value
(38.6%)
Prior Value compares a measured value with the previously measured value. Confidence intervals were not taken into account in determining the direction of the comparison.
Trend
This comparison measures the indicator’s values over multiple time periods.<br>The Mann-Kendall Test for Statistical Significance is used to evaluate the trend<br>over 4 to 10 periods of measure, subject to data availability and comparability.
